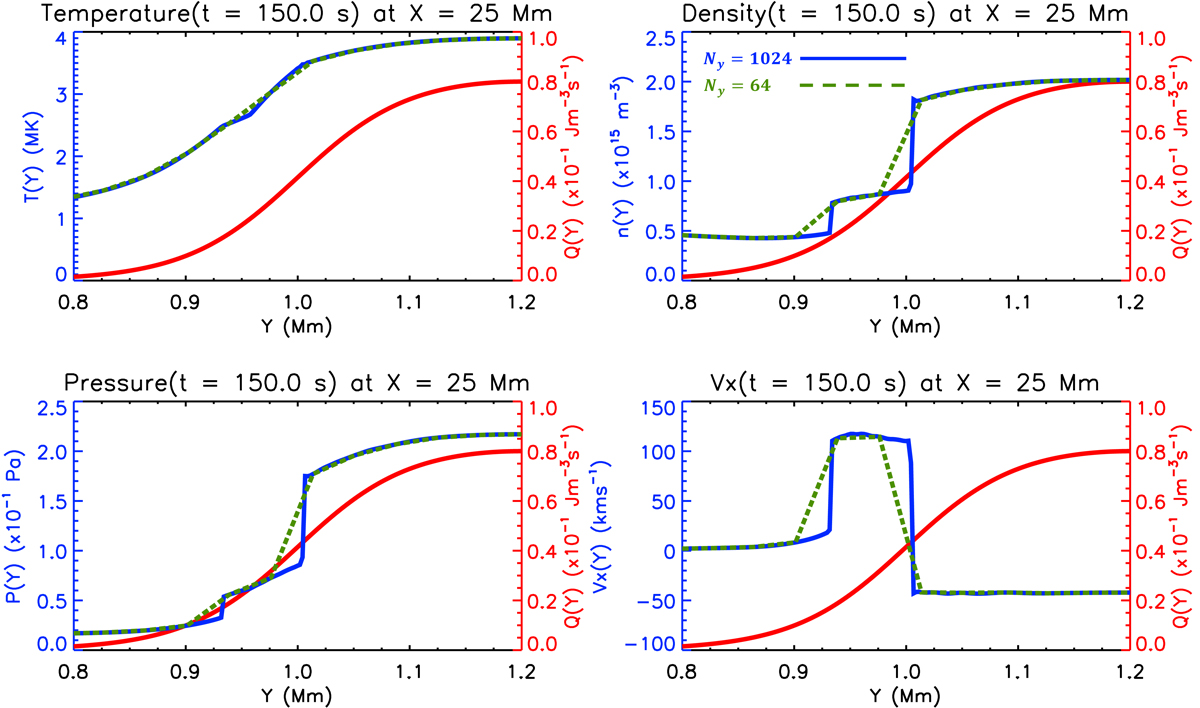
Fig. 3.
Download original image
Results for the reconstruction of the non-uniform coronal heating pulse using one-dimensional HD simulations of the unsheared arcade (Sect. 3.3). The panels show the temperature, density, pressure, and field-aligned velocity as functions of position across the arcade (left-hand axis), at a coronal height of x = 25 Mm, at the time of the first density peak (t = 150 s). The lines are colour coded in a way that reflects the transverse resolution used with solid blue (dashed green) representing the Ny = 1024 (Ny = 64) solution, which is imposed on top of the transverse heating profile (solid red line, right-hand axis).
Current usage metrics show cumulative count of Article Views (full-text article views including HTML views, PDF and ePub downloads, according to the available data) and Abstracts Views on Vision4Press platform.
Data correspond to usage on the plateform after 2015. The current usage metrics is available 48-96 hours after online publication and is updated daily on week days.
Initial download of the metrics may take a while.