Free Access
Fig. 2.
Download original image
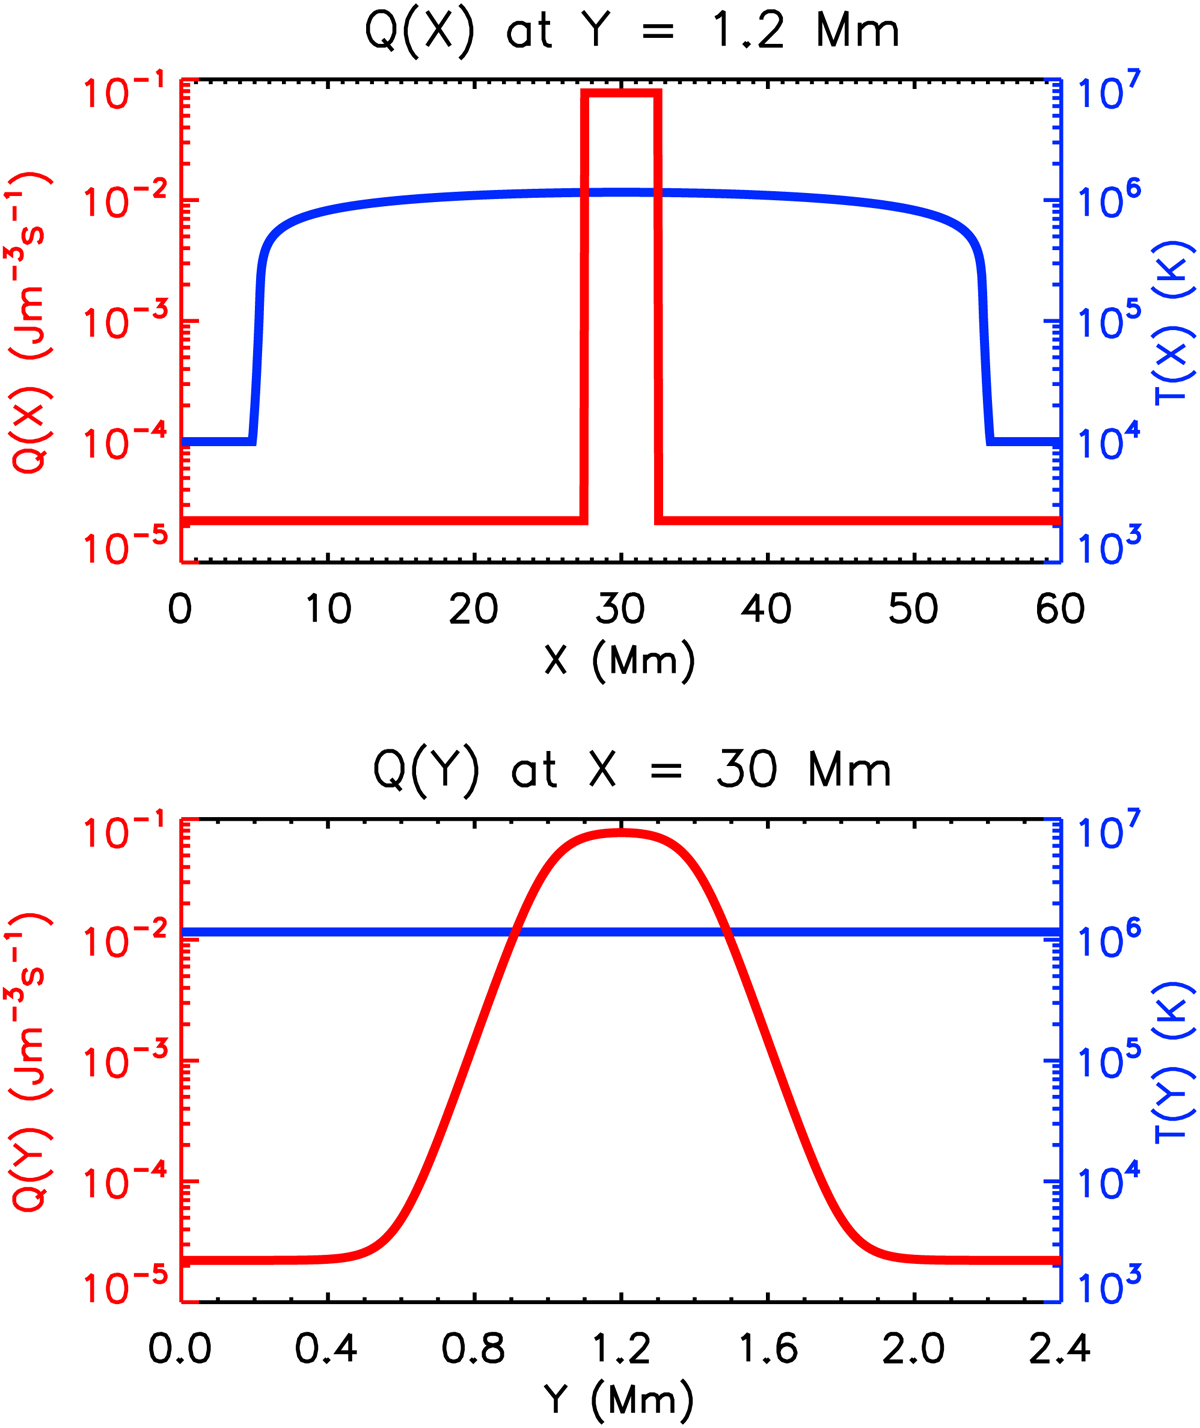
Spatially non-uniform heating profile Q(x, y) (solid red line, left-hand axis) used in Sects. 3 and 4, imposed on top of the temperature initial condition (solid blue line, right-hand axis). Upper (lower) panel: variation of the heating profile in the field-aligned (transverse) direction at the time of peak heating.
Current usage metrics show cumulative count of Article Views (full-text article views including HTML views, PDF and ePub downloads, according to the available data) and Abstracts Views on Vision4Press platform.
Data correspond to usage on the plateform after 2015. The current usage metrics is available 48-96 hours after online publication and is updated daily on week days.
Initial download of the metrics may take a while.