Fig. A.1.
Download original image
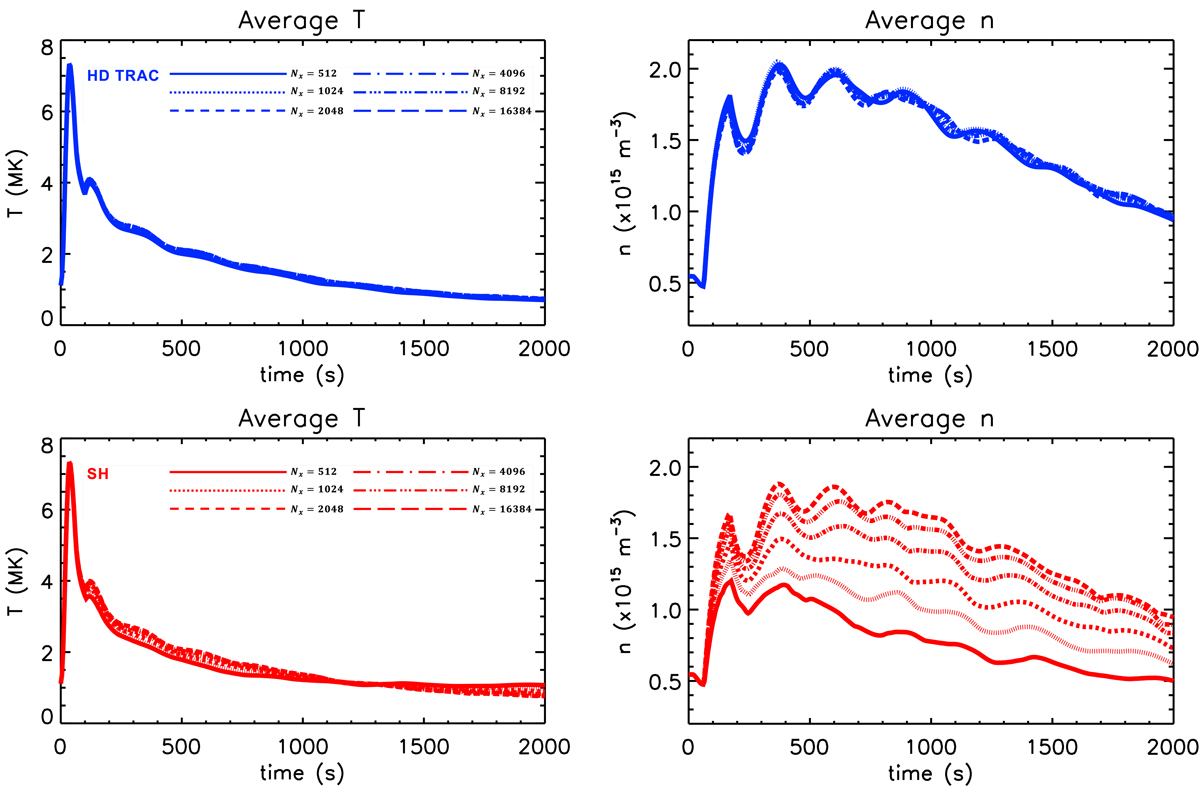
Results for the non-uniform coronal heating pulse using one-dimensional HD simulations of the unsheared arcade (Sect. 3.3). The panels show the coronal averaged temperature (left-hand column) and density (right-hand column) at y = 1.2 Mm, as functions of time. The various curves represent different values of Nx, which converge as Nx increases (higher spatial resolution in the field-aligned direction is associated with larger Nx). Rows 1 and 2 correspond to simulations run with the HD implementation of TRAC (Sect. 2.2.1) and the SH conduction method, respectively. The lines are colour-coded in a way that reflects the conduction method used.
Current usage metrics show cumulative count of Article Views (full-text article views including HTML views, PDF and ePub downloads, according to the available data) and Abstracts Views on Vision4Press platform.
Data correspond to usage on the plateform after 2015. The current usage metrics is available 48-96 hours after online publication and is updated daily on week days.
Initial download of the metrics may take a while.