Fig. 1.
Download original image
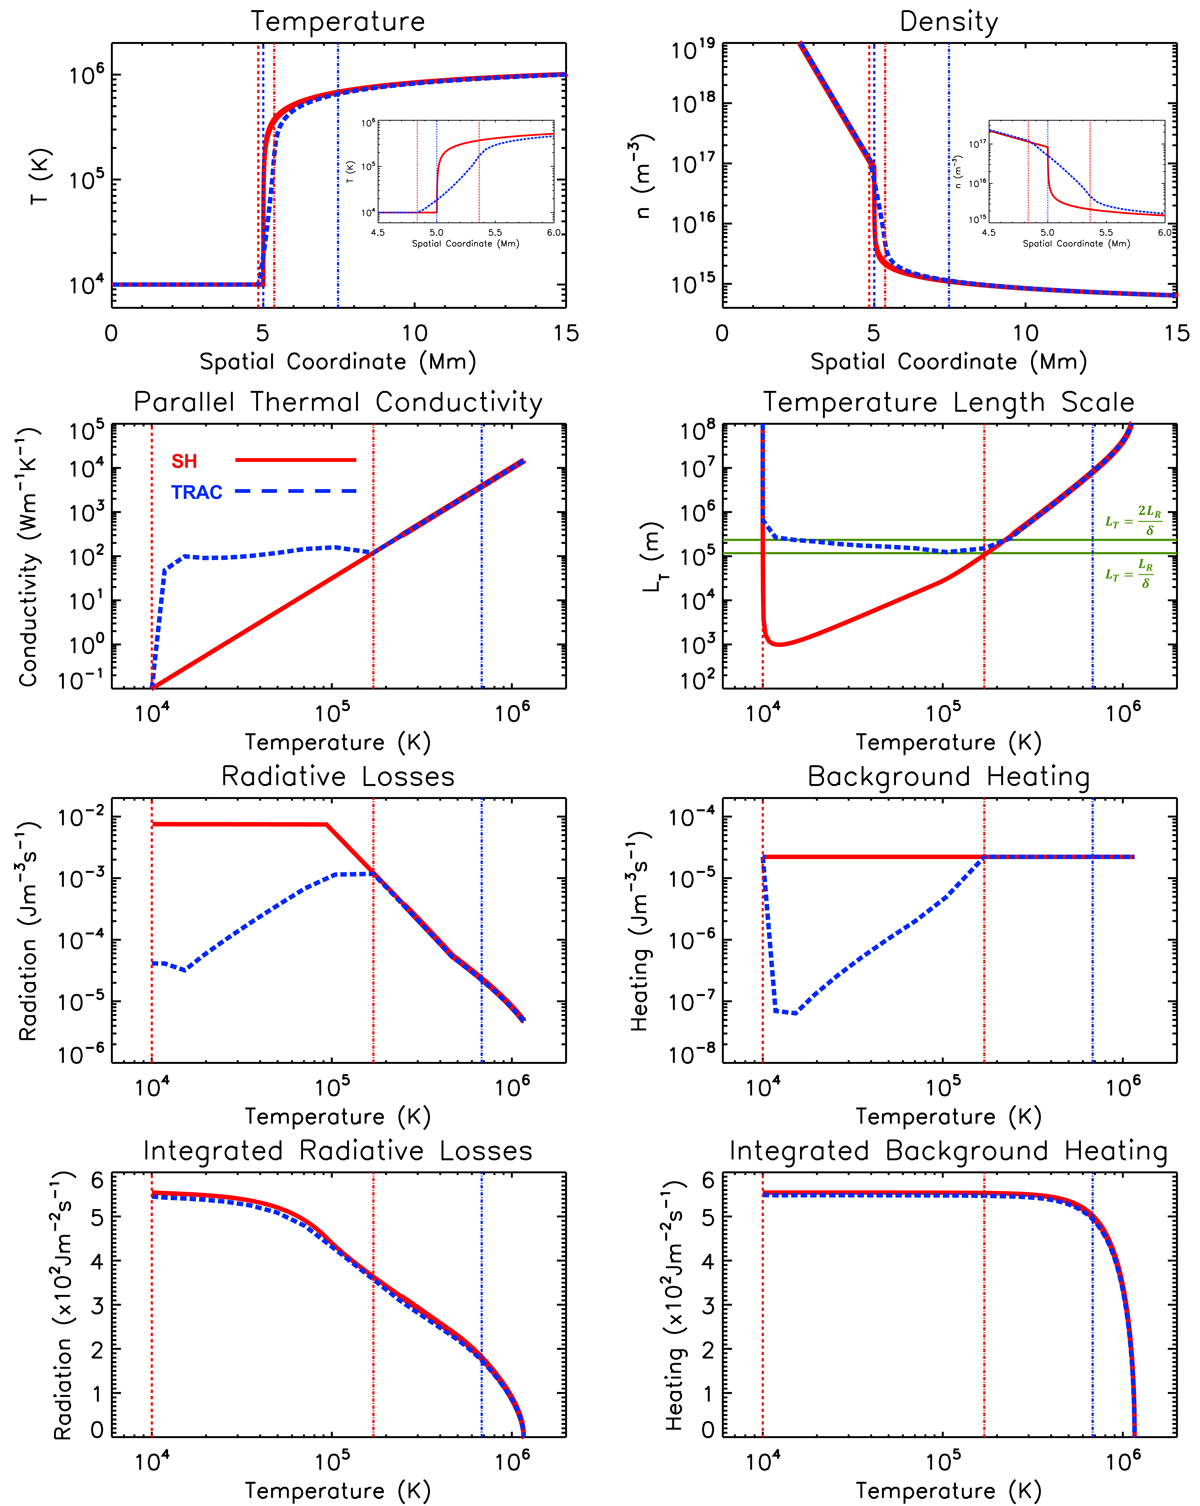
Comparison of the SH and TRAC conduction methods for a one-dimensional loop in hydrostatic equilibrium. Upper two panels: temperature and density as functions of position along the loop. Lower six panels: parallel thermal conductivity, temperature length scale, local radiative losses, local background heating rate, integrated radiative losses, and integrated background heating as functions of temperature. The lines are colour-coded in a way that reflects the conduction method used with dashed blue (solid red) representing the TRAC (SH) solution. The dashed red (blue) vertical line indicates the base of the TRAC (SH) TR and the dot-dashed red (blue) vertical line the temperature at the top of the TRAC region (the temperature at the top of the TR).
Current usage metrics show cumulative count of Article Views (full-text article views including HTML views, PDF and ePub downloads, according to the available data) and Abstracts Views on Vision4Press platform.
Data correspond to usage on the plateform after 2015. The current usage metrics is available 48-96 hours after online publication and is updated daily on week days.
Initial download of the metrics may take a while.