Fig. 8.
Download original image
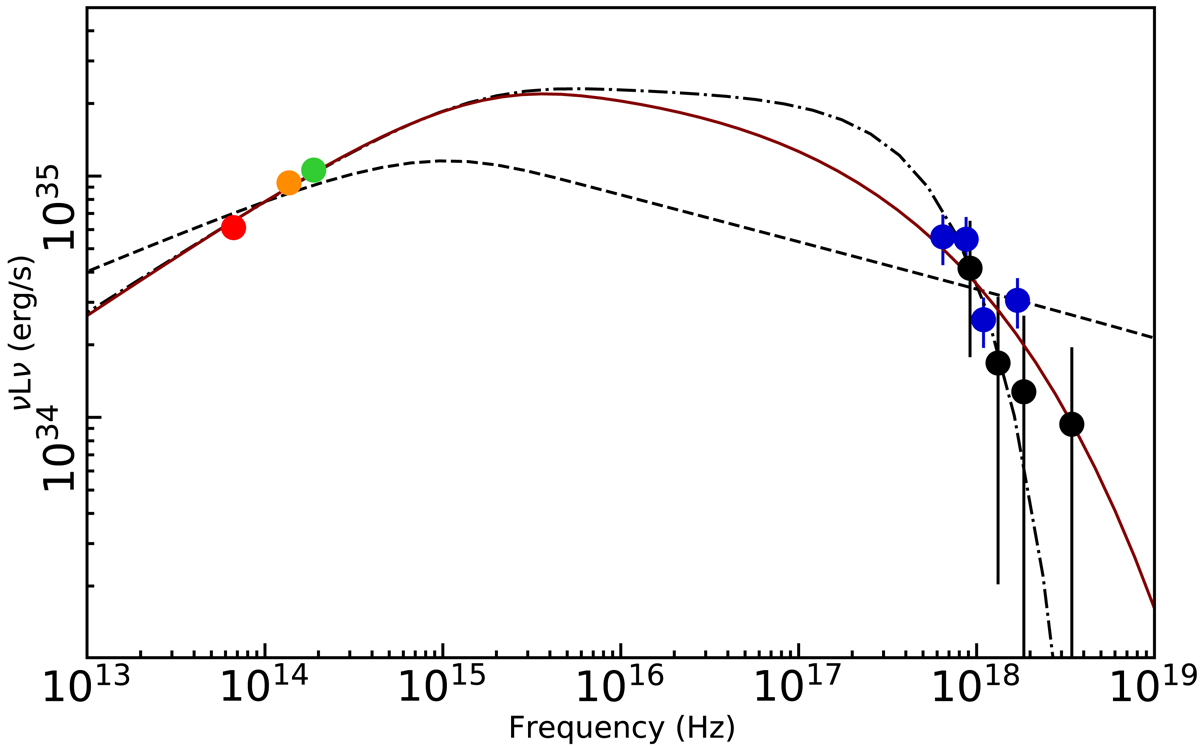
Mean SED of Sgr A⋆ during the flare as in Fig. 4, including the best-fit synchrotron models. The black dashed line shows the best-fit PLCool model (synchrotron with cooling break model with no high-energy cutoff). This model is ruled out because it cannot fit the difference in X-ray vs. IR spectral slopes due to the X-ray vs. IR flux ratio. The dashed-dotted black lines shows the best fit PLCoolγmaxsharp model (synchrotron with cooling break plus a sharp γmax cutoff). The line cuts off too sharply in the X-ray and fails to reproduce the high-energy NuSTAR data. The dark red line shows the best-fit PLCoolγmax model (synchrotron with cooling break plus an exponential high energy cutoff). For this model, the SSC component, which peaks at ν ∼ 1023 Hz, is also computed (not shown here, see Fig. A.1).
Current usage metrics show cumulative count of Article Views (full-text article views including HTML views, PDF and ePub downloads, according to the available data) and Abstracts Views on Vision4Press platform.
Data correspond to usage on the plateform after 2015. The current usage metrics is available 48-96 hours after online publication and is updated daily on week days.
Initial download of the metrics may take a while.