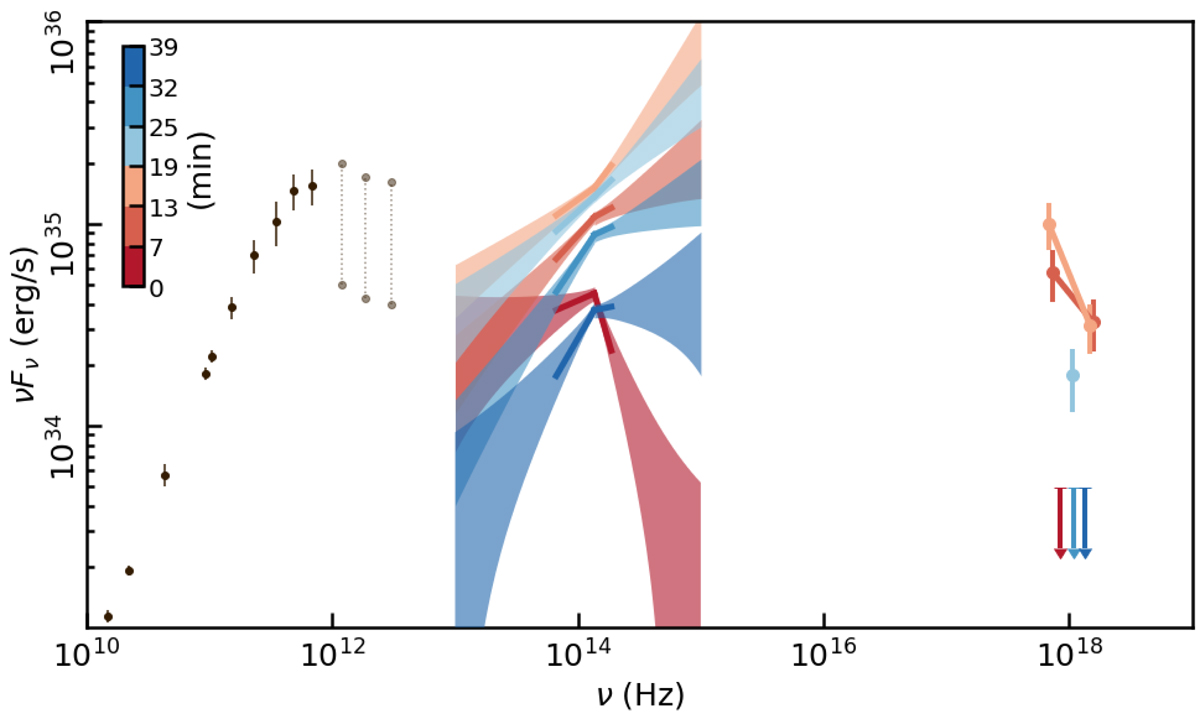
Fig. 7.
Download original image
Temporal evolution of the SED. The color encodes the time: dark red to dark blue as indicated in the color bar. For two time steps, the X-ray spectrum can be split up into two points (T2 and T3). For T4, only one X-ray flux measurement is possible. The upper limits are plotted for T1, T5, and T6. The measurements in the NIR are indicated by thick lines, with the uncertainties indicated and extrapolated by the shaded area. The submillimeter data shown are the same as in Fig. 4.
Current usage metrics show cumulative count of Article Views (full-text article views including HTML views, PDF and ePub downloads, according to the available data) and Abstracts Views on Vision4Press platform.
Data correspond to usage on the plateform after 2015. The current usage metrics is available 48-96 hours after online publication and is updated daily on week days.
Initial download of the metrics may take a while.