Fig. 5.
Download original image
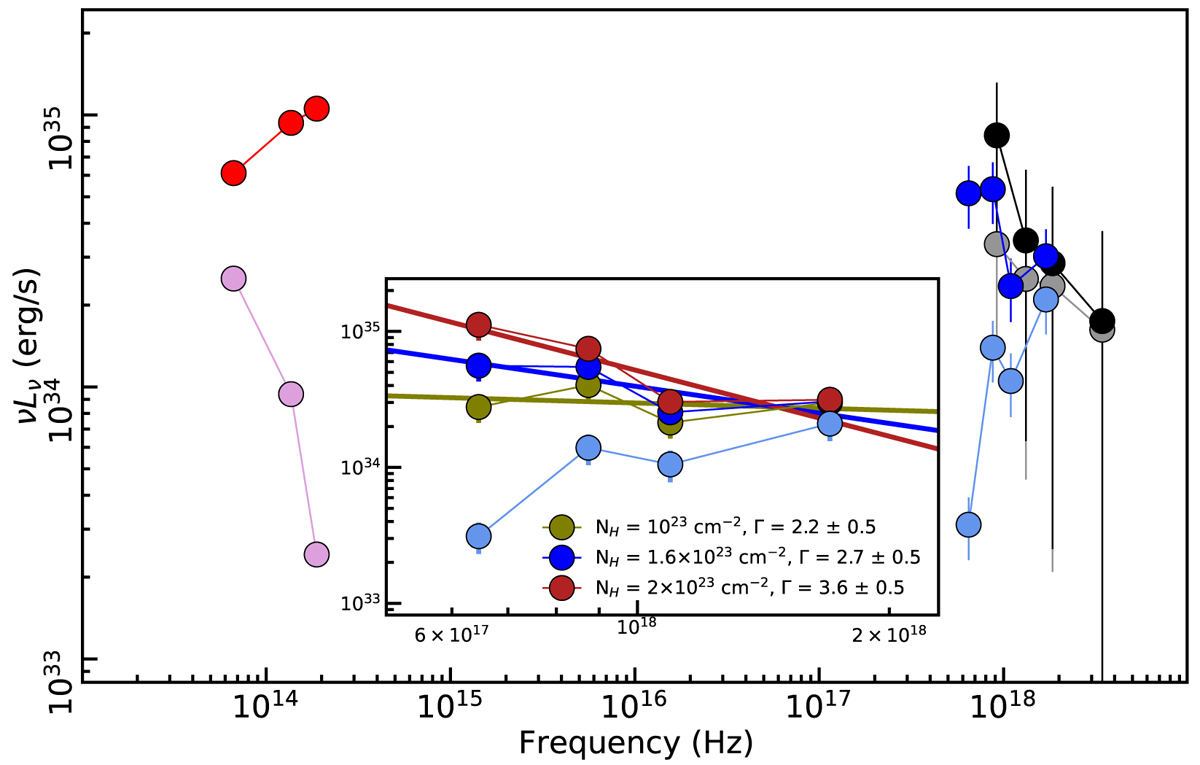
Main panel: comparison between observed and corrected spectra. The cyan, gray, and pink points show the spectra as observed by Chandra, NuSTAR, and in the IR band, respectively. The blue, black, and red points show the same data corrected for absorption and the effects of dust scattering. The correction amounts to more than one order of magnitude in K and H as well as in the soft X-ray band. Inset: as in the main panel, the cyan points show the spectrum as observed by Chandra. The olive, blue, and dark red points show the Chandra spectrum after correction assuming NH = 1023, 1.6 × 10²³, and 2 × 1023 cm−2, respectively.
Current usage metrics show cumulative count of Article Views (full-text article views including HTML views, PDF and ePub downloads, according to the available data) and Abstracts Views on Vision4Press platform.
Data correspond to usage on the plateform after 2015. The current usage metrics is available 48-96 hours after online publication and is updated daily on week days.
Initial download of the metrics may take a while.