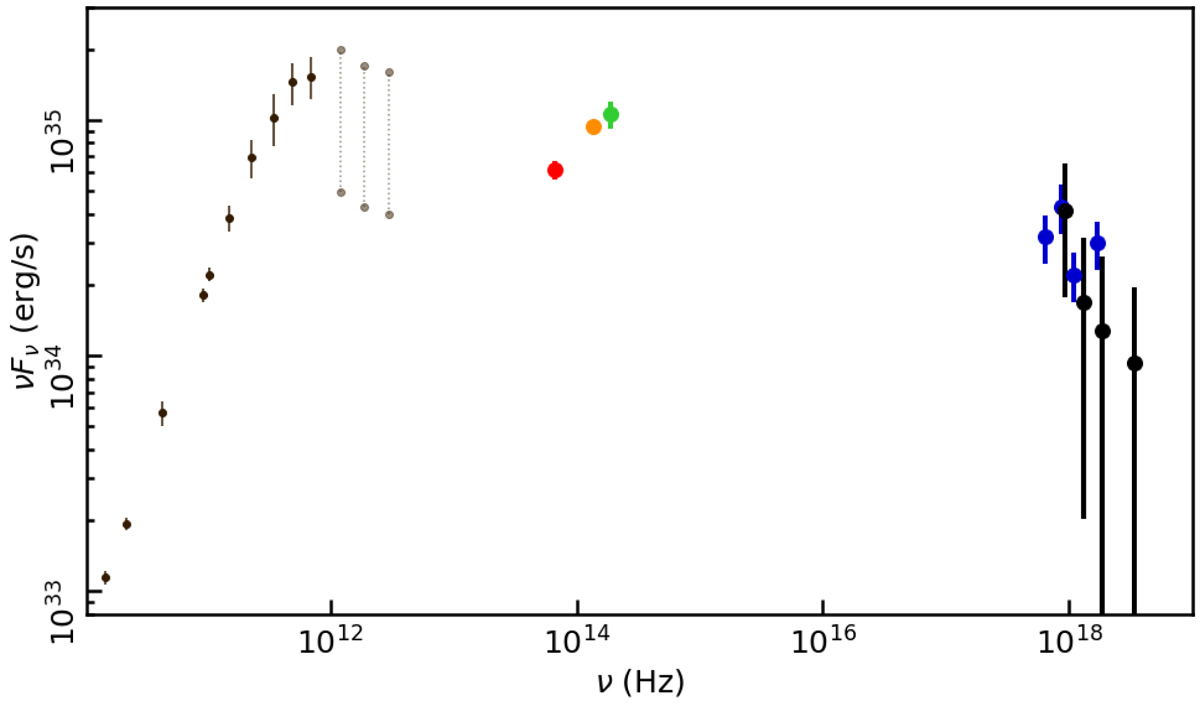
Fig. 4.
Download original image
Mean SED plotted together with the best-fit power-law slope. The submillimeter SED is plotted for orientation; the radio and submillimeter data are from Falcke et al. (1998), Bower et al. (2015, 2019), Brinkerink et al. (2015), Liu et al. (2016). The far-infrared data are from Stone et al. (2016) and von Fellenberg et al. (2018).
Current usage metrics show cumulative count of Article Views (full-text article views including HTML views, PDF and ePub downloads, according to the available data) and Abstracts Views on Vision4Press platform.
Data correspond to usage on the plateform after 2015. The current usage metrics is available 48-96 hours after online publication and is updated daily on week days.
Initial download of the metrics may take a while.