Fig. 3.
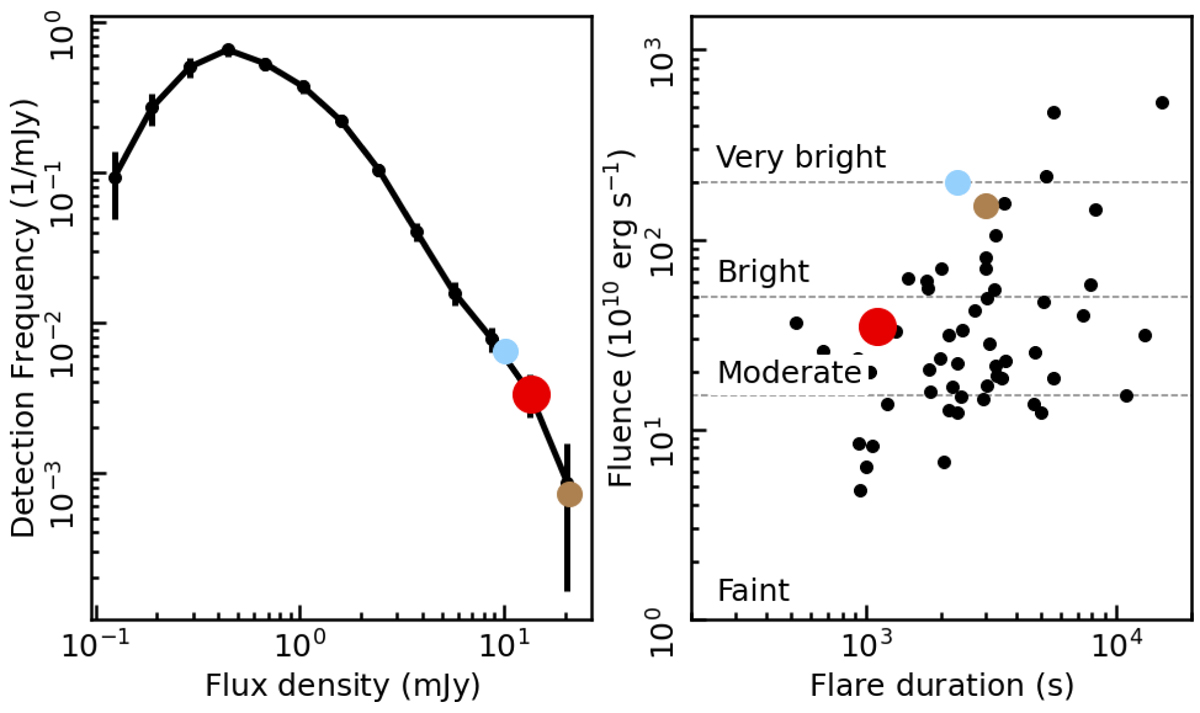
Download original image
Left: GRAVITY K-band flux density distribution as reported in GRAVITY Collaboration (2020c) and the peak flux densities of three bright flares. The red point indicates the peak flux density of the flare analyzed in this paper. The light blue point indicates the peak flux reported by Ponti et al. (2017) observed with SINFONI. The light brown point represents the peak L′-band flux density scaled to 2.2 μm, assuming a flux density scale FK band = FL′ band ⋅ (νK/νL′)−0.5. Right: duration and fluence of all flares of Sgr A⋆ detected by XMM-Newton and Chandra before 2015 (see Neilsen et al. 2013; Ponti et al. 2015). Partial (i.e., only partially covered) and dubious flares have been omitted. As in the left plot, the red, light blue, and dark blue circles show the duration and fluence of the X-ray flares investigated in this work, by Ponti et al. (2017), and by Dodds-Eden et al. (2009).
Current usage metrics show cumulative count of Article Views (full-text article views including HTML views, PDF and ePub downloads, according to the available data) and Abstracts Views on Vision4Press platform.
Data correspond to usage on the plateform after 2015. The current usage metrics is available 48-96 hours after online publication and is updated daily on week days.
Initial download of the metrics may take a while.