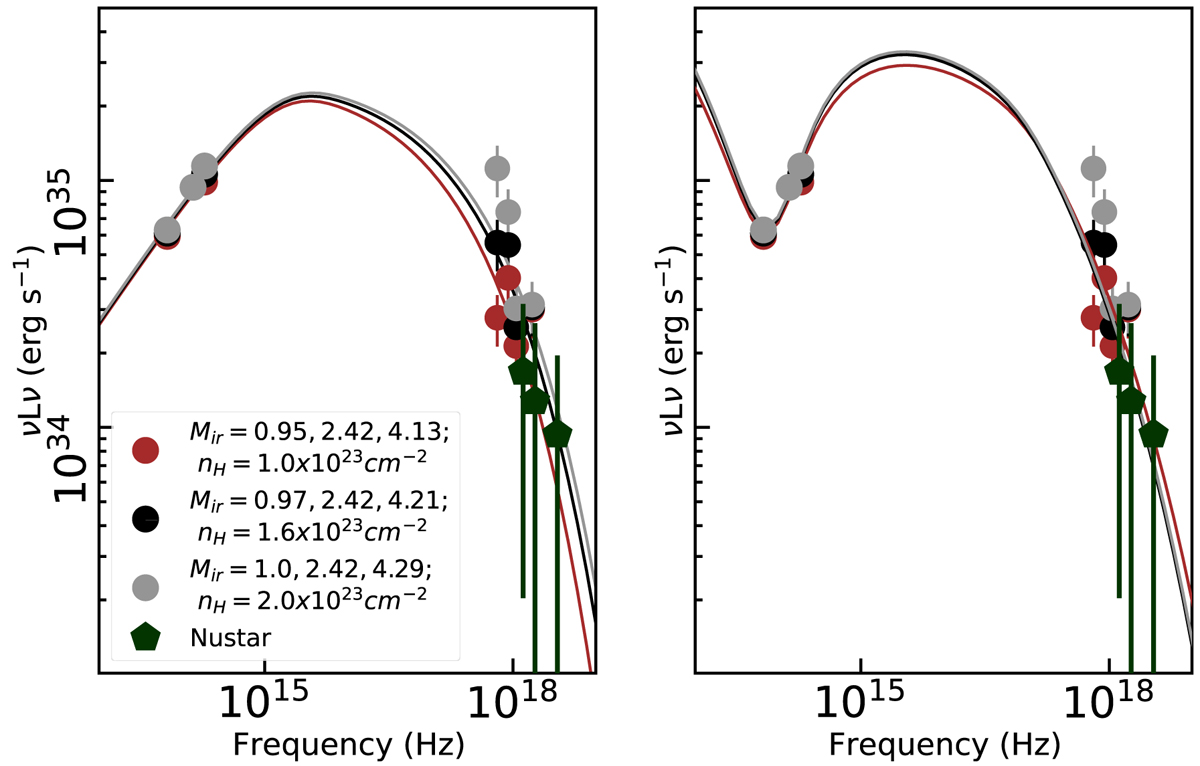
Fig. C.1.
Download original image
Effect of different neutral material column density: NIR data same as Figure 4. Both panels: the red, black and gray lines show the data corrected with different plausible neutral material column densities, which are reported in the legend of the left panel. The NuSTAR data have not been re-reduced (green pentagons) because the high-energy data is only marginally affected. The lowest energy bin from the NuSTAR spectrum has been removed because it might be affected by the extinction. The models in the left panel are PLCoolγmax type models, the SCC-SSC type models are plotted on the right, and the color indicates the respective data set fitted.
Current usage metrics show cumulative count of Article Views (full-text article views including HTML views, PDF and ePub downloads, according to the available data) and Abstracts Views on Vision4Press platform.
Data correspond to usage on the plateform after 2015. The current usage metrics is available 48-96 hours after online publication and is updated daily on week days.
Initial download of the metrics may take a while.