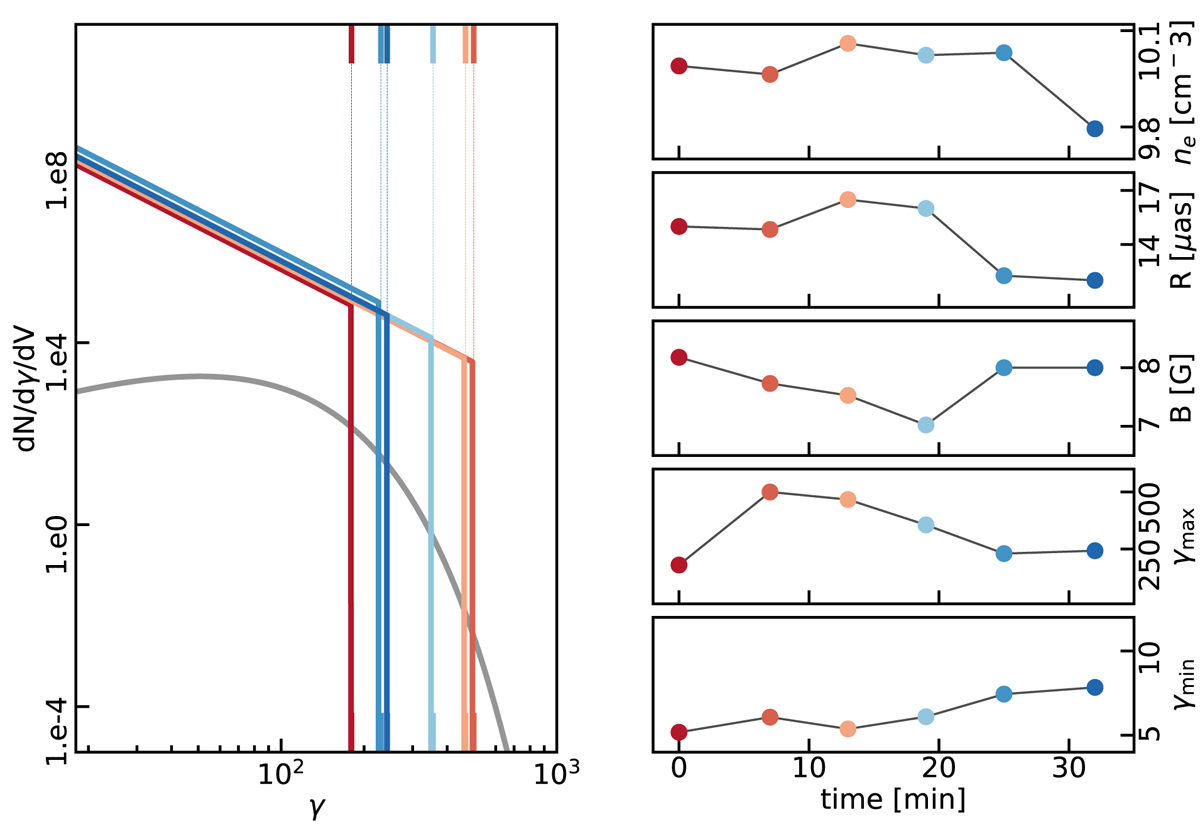
Fig. 13.
Download original image
SSC parameter evolution during flare, analogous to Fig. 10. Left: evolution of the electron distribution during the flare. The dash-dotted lines indicate the location of γmax. The gray line shows the thermal distribution of electrons, peaking at γ ∼ 50, which sets the minimum acceleration of the electrons for the flare. Right: evolution of the model parameters ne, R, B, γmax, and γmin. For the SSC models γmax is significantly lower and ne significantly higher than for the PLCoolγmax model.
Current usage metrics show cumulative count of Article Views (full-text article views including HTML views, PDF and ePub downloads, according to the available data) and Abstracts Views on Vision4Press platform.
Data correspond to usage on the plateform after 2015. The current usage metrics is available 48-96 hours after online publication and is updated daily on week days.
Initial download of the metrics may take a while.