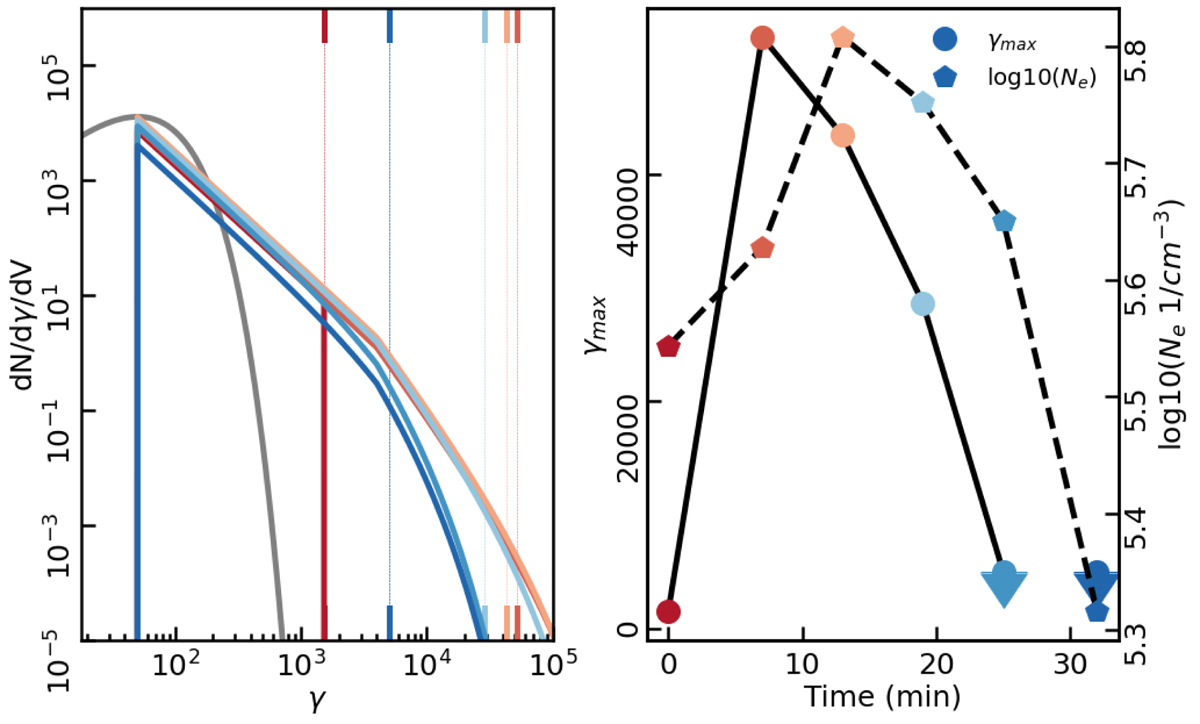
Fig. 10.
Download original image
Left: evolution of the electron distribution during the flare. The different temporal steps are plotted dark red (T1), progressing to lighter reds (T3), to light blue (T4), to dark blue (T6). The dotted lines indicate the location of γmax. The gray line shows a thermal distribution of electrons, peaking at γ ∼ 50, which set the minimum acceleration of the electrons for the flare. Right: evolution of the distribution parameters γmax (shown by the solid line) and ne (shown by the dashed line).
Current usage metrics show cumulative count of Article Views (full-text article views including HTML views, PDF and ePub downloads, according to the available data) and Abstracts Views on Vision4Press platform.
Data correspond to usage on the plateform after 2015. The current usage metrics is available 48-96 hours after online publication and is updated daily on week days.
Initial download of the metrics may take a while.