Fig. 10.
Download original image
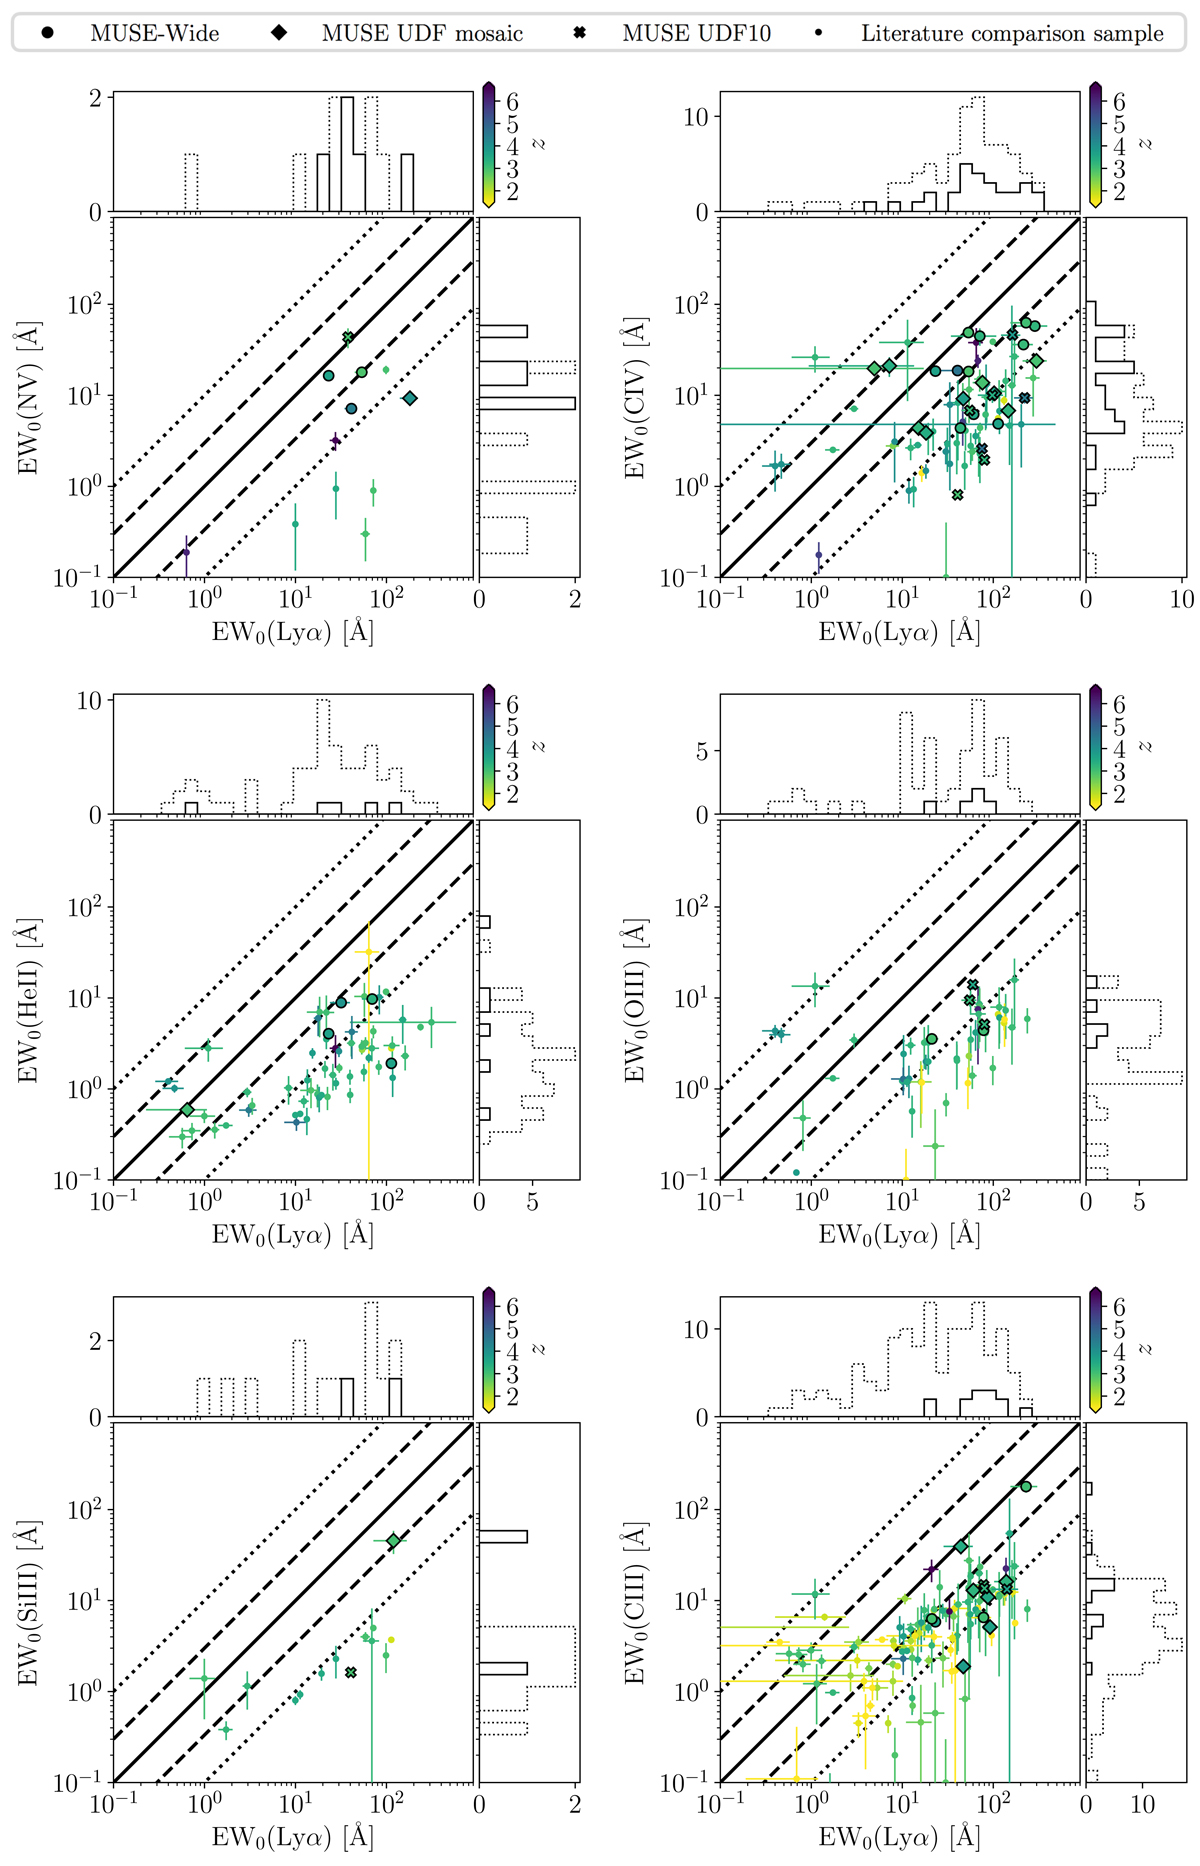
UV emission line EW0 estimates of LAEs as a function of EW0(Lyα). The measurements from the current study are shown as large symbols (circles from MUSE-Wide, diamonds from the UDF mosaic, and x’s from UDF10). Measurements from the literature are shown by small dots (see Appendix C). All symbols are color coded according to source redshifts and are shown with 1σ error bars. The diagonal curves correspond to the relations 10:1, 3:1, 1:1, 1:3, and 1:10 for reference. Solid histograms show objects presented in this study, whereas dotted histograms include the literature samples.
Current usage metrics show cumulative count of Article Views (full-text article views including HTML views, PDF and ePub downloads, according to the available data) and Abstracts Views on Vision4Press platform.
Data correspond to usage on the plateform after 2015. The current usage metrics is available 48-96 hours after online publication and is updated daily on week days.
Initial download of the metrics may take a while.