Fig. 6
Download original image
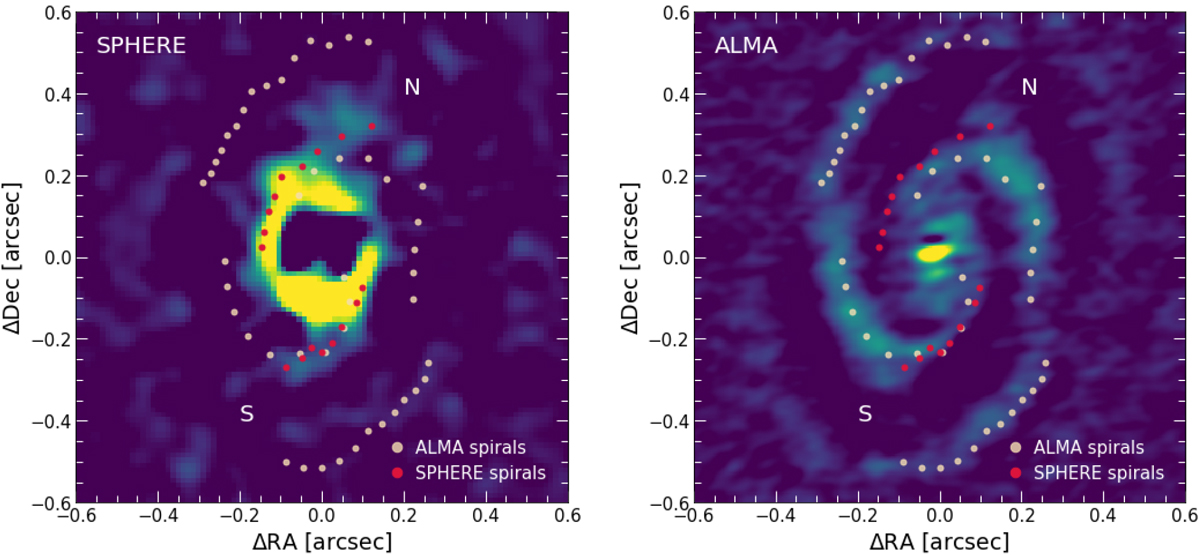
Left: SPHERE Qϕ image as described in Fig. 2 but with a Gaussian kernel of size 0.2 × FWHM with the spiral arms retrieved from both the ALMA and this image overplotted. Right: ALMA continuum image generated as described in the Appendix C, with the overplotted spiral arms retrieved from both the SPHERE Qϕ and this image. The “N” and “S” indicate the northern and southern spirals, respectively.
Current usage metrics show cumulative count of Article Views (full-text article views including HTML views, PDF and ePub downloads, according to the available data) and Abstracts Views on Vision4Press platform.
Data correspond to usage on the plateform after 2015. The current usage metrics is available 48-96 hours after online publication and is updated daily on week days.
Initial download of the metrics may take a while.