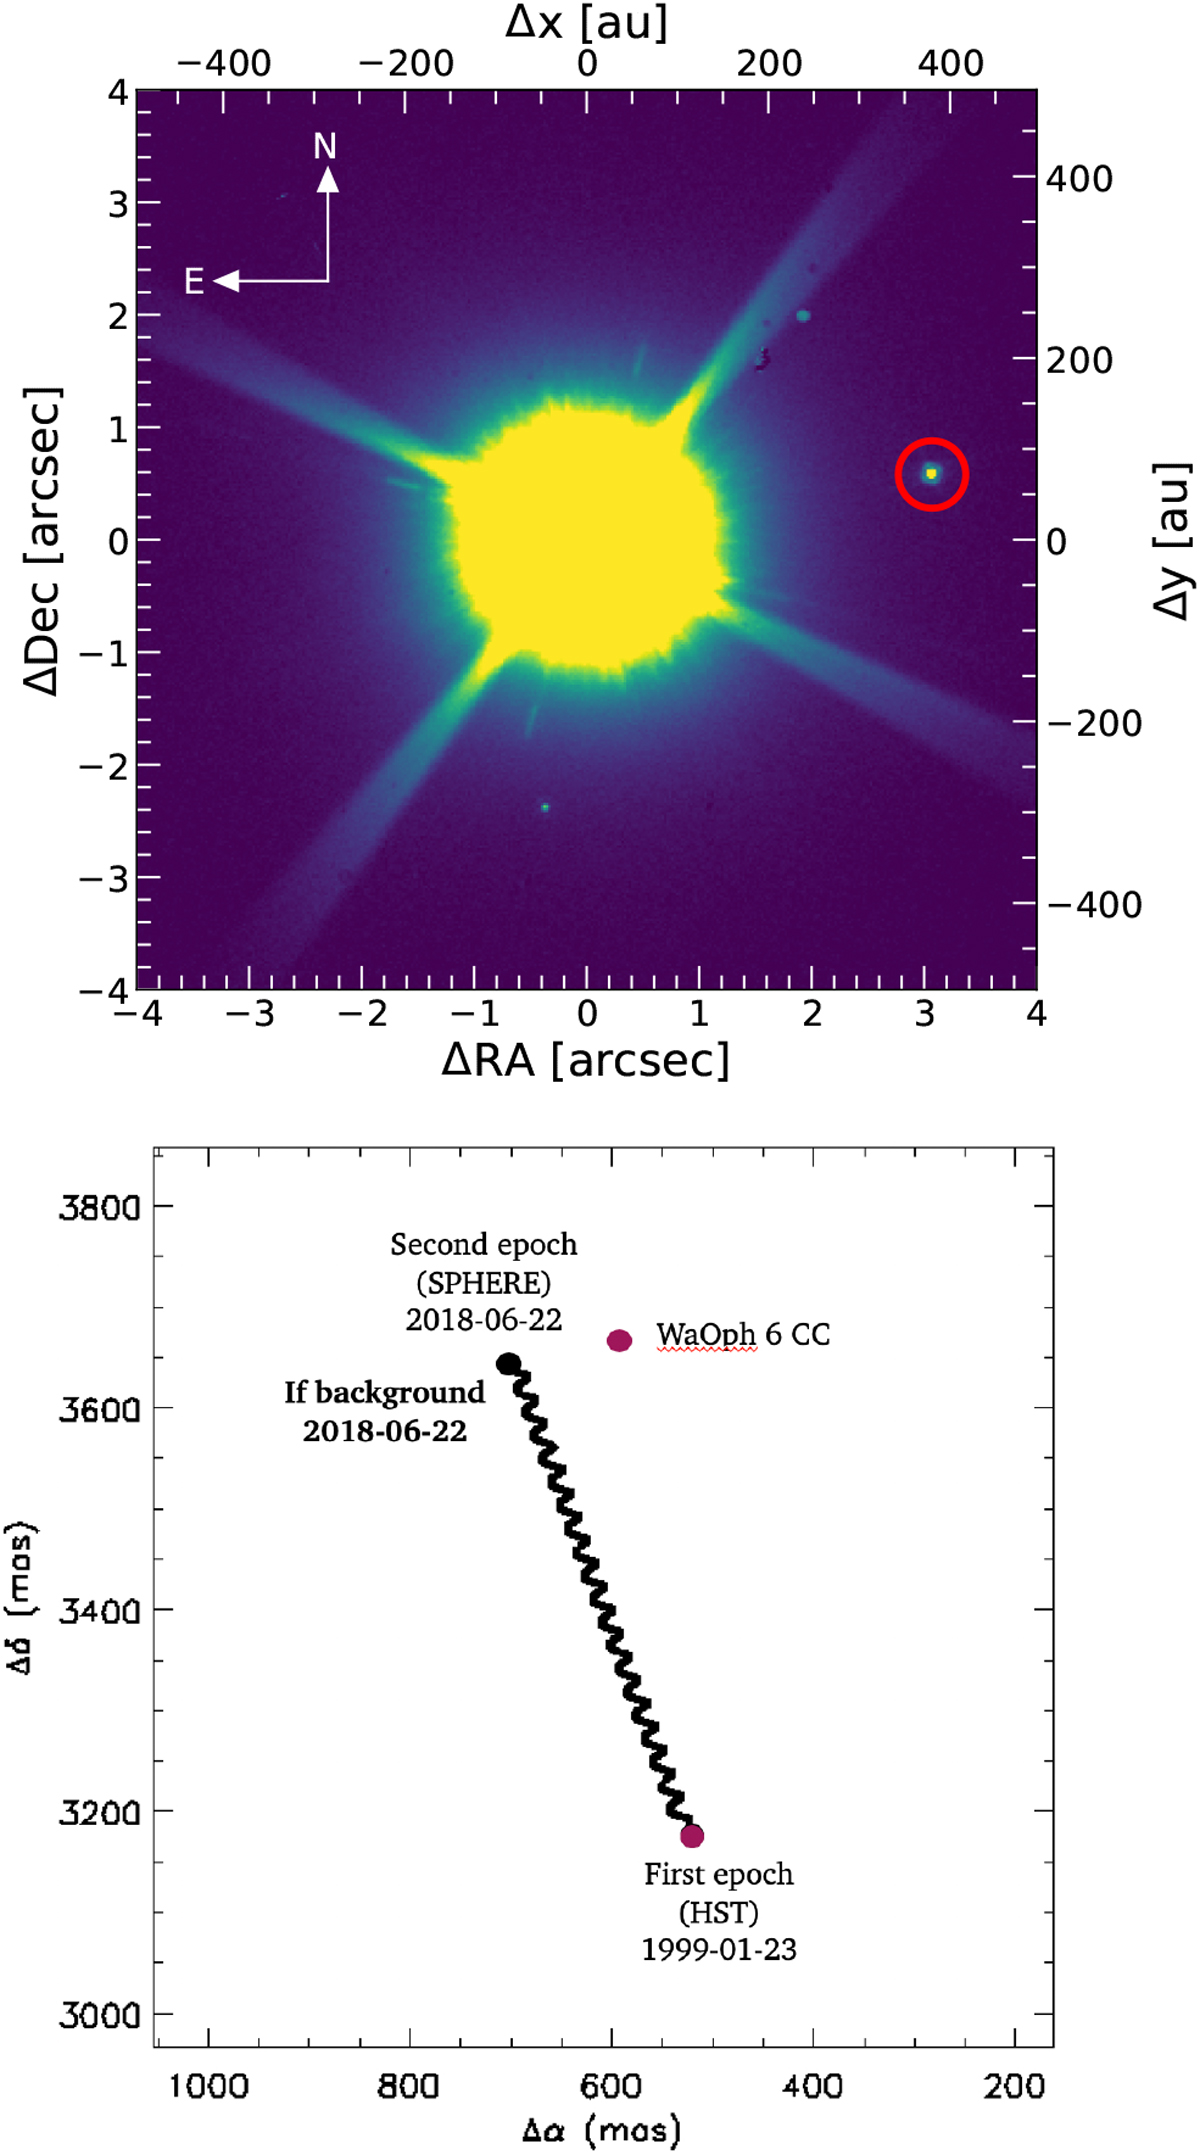
Fig. 4
Download original image
Top: total intensity SPHERE/IRDIS-DPI image of WaOph 6. Encircled in red is the CC. Bottom: astrometry plot of the CC of WaOph 6. The markers show the position of the CC, at the initial HST epoch, and further in time at the SPHERE epoch. The black curve traces the path a stationary background object would have followed relative to WaOph 6 between the two epochs.
Current usage metrics show cumulative count of Article Views (full-text article views including HTML views, PDF and ePub downloads, according to the available data) and Abstracts Views on Vision4Press platform.
Data correspond to usage on the plateform after 2015. The current usage metrics is available 48-96 hours after online publication and is updated daily on week days.
Initial download of the metrics may take a while.