Open Access
Fig. E.1
Download original image
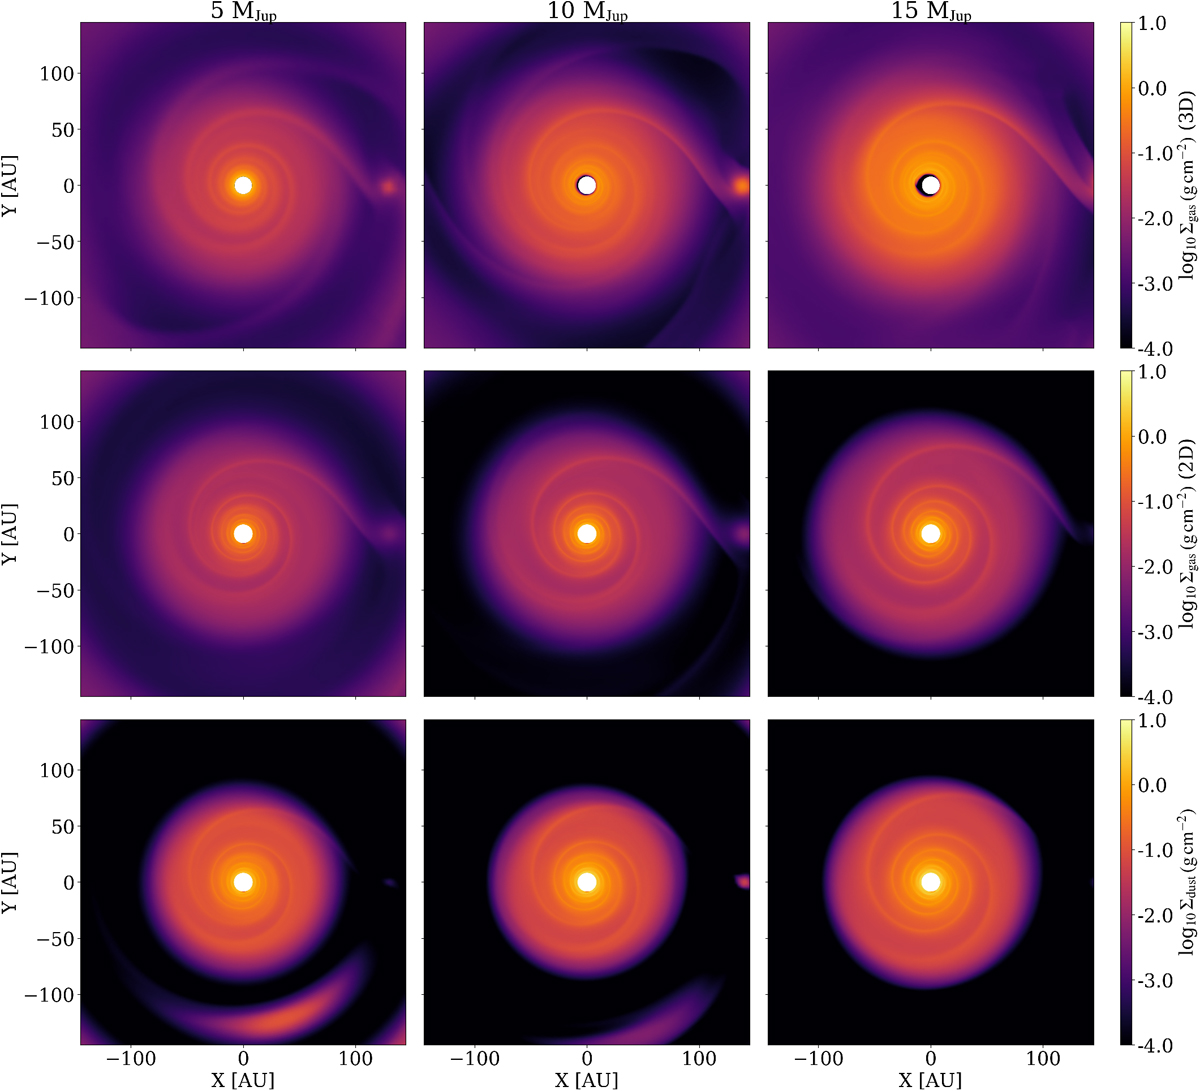
Density maps from our 3D (top panels) and 2D (middle and bottom panels) hydrodynamical simulations for planets of 5, 10 and 15 MJup at separations of 130, 140 and 160 au, respectively, shown from left to right. The top and middle panels show the gas surface density maps, while the bottom panels show the dust density maps.
Current usage metrics show cumulative count of Article Views (full-text article views including HTML views, PDF and ePub downloads, according to the available data) and Abstracts Views on Vision4Press platform.
Data correspond to usage on the plateform after 2015. The current usage metrics is available 48-96 hours after online publication and is updated daily on week days.
Initial download of the metrics may take a while.