Fig. 2
Download original image
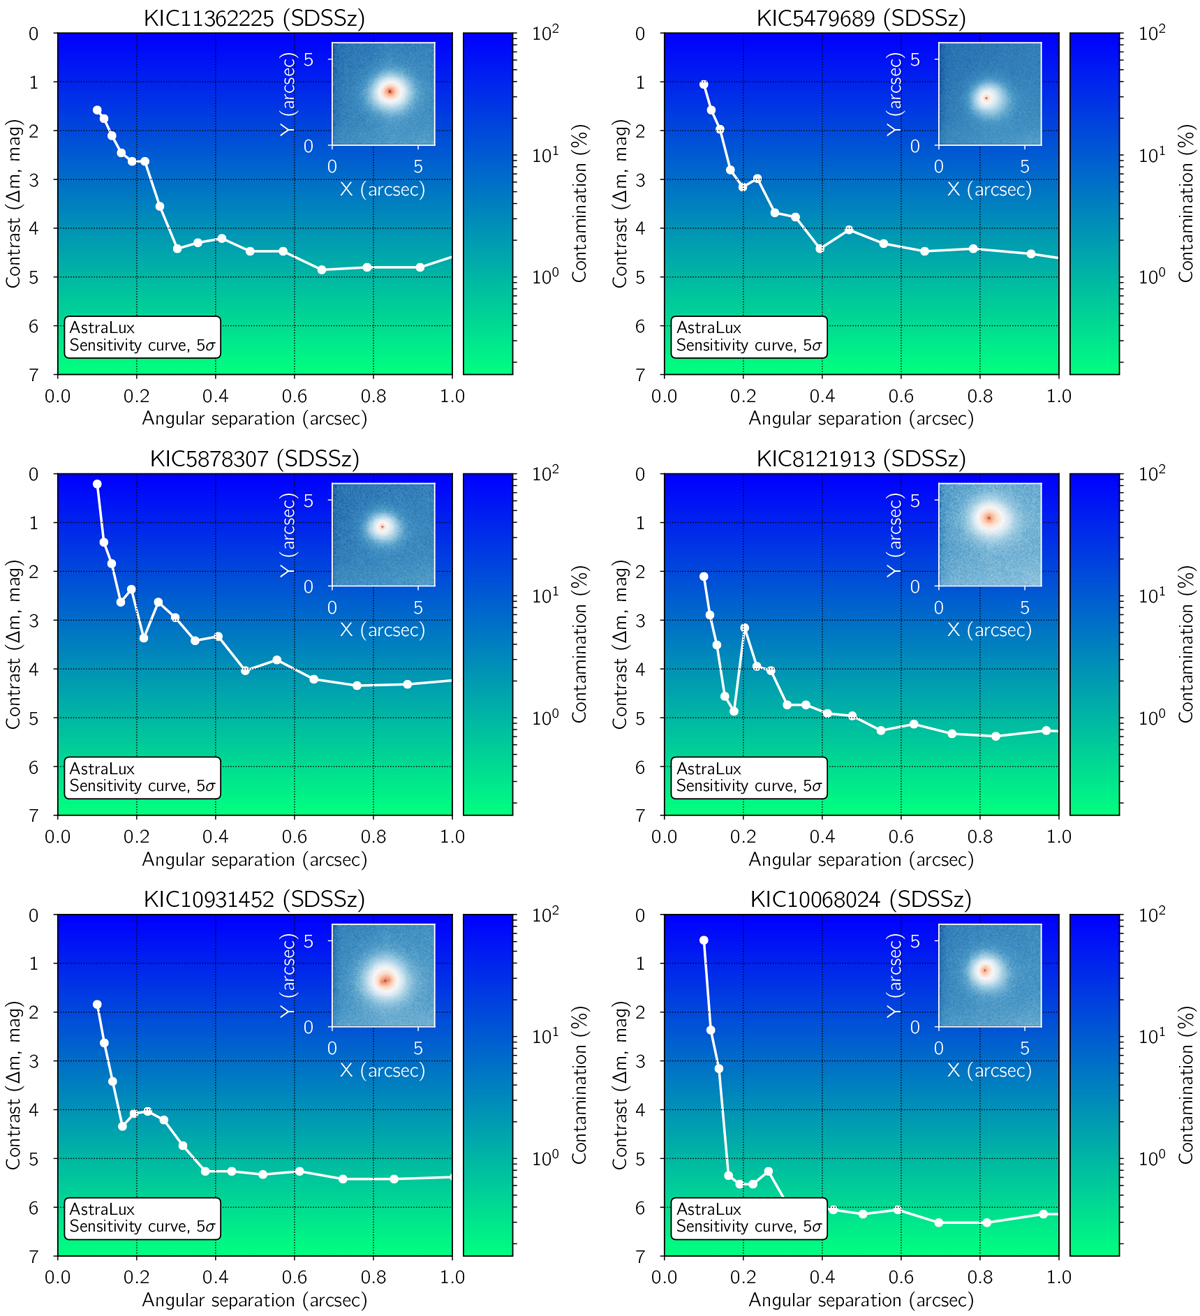
Results of the analysis of the high-spatial resolution images obtained with the AstraLux lucky-imaging instrument. Each panel shows the contrast curve calculated as in Lillo-Box et al. (2014) as a white line. The color-code of the contrast curve represents the contamination produced by a blended star of the given magnitude contrast as shown in the color bar. The inset panel displays the AstraLux image, with redder colors indicating more intensity.
Current usage metrics show cumulative count of Article Views (full-text article views including HTML views, PDF and ePub downloads, according to the available data) and Abstracts Views on Vision4Press platform.
Data correspond to usage on the plateform after 2015. The current usage metrics is available 48-96 hours after online publication and is updated daily on week days.
Initial download of the metrics may take a while.