Fig. 4.
Download original image
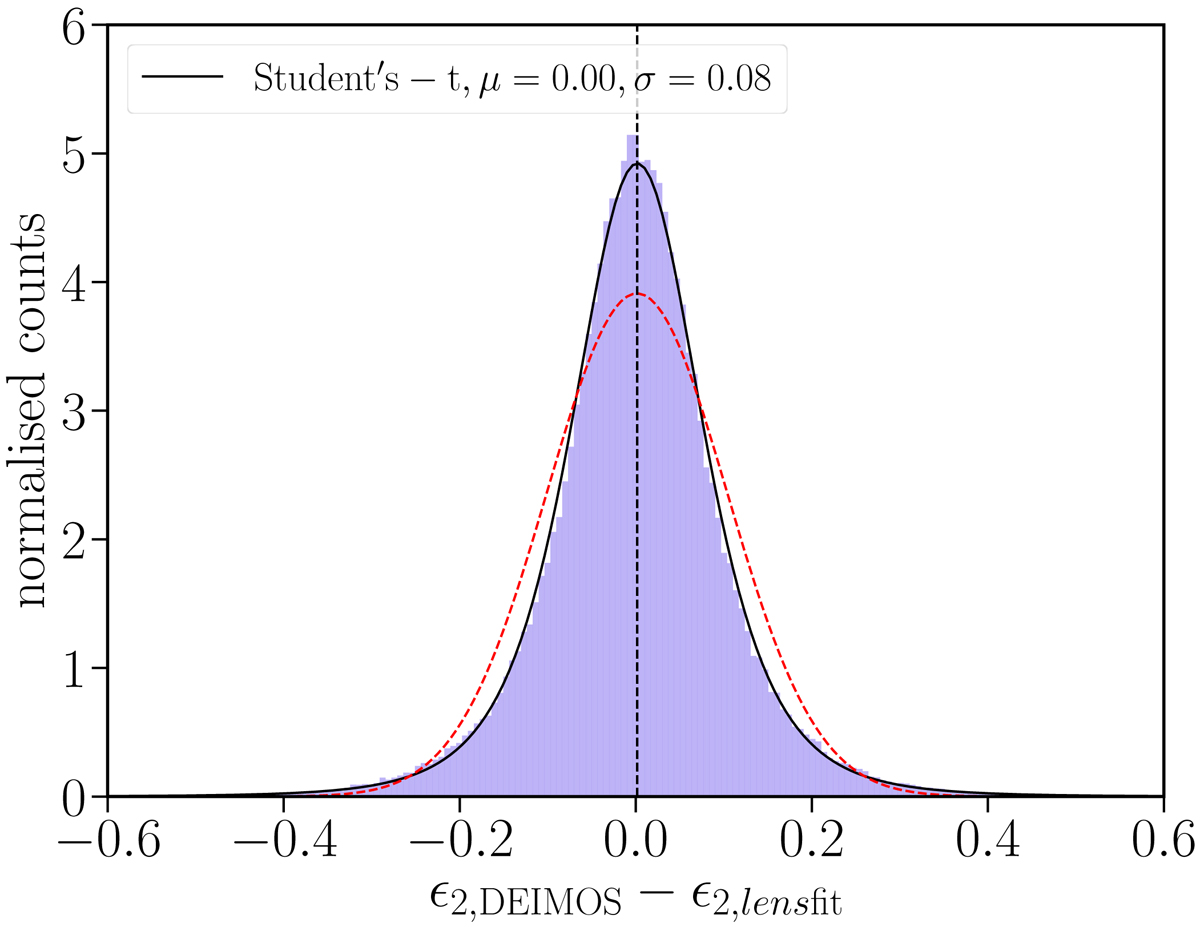
Histogram of the difference of the ϵ1 component of the ellipticity measured by the two shape measurement algorithms, lensfit and DEIMOS, on a common sub-sample of galaxies, after applying the m-bias correction as described in the text. The ϵ2 component shows the same behaviour. The distribution is more peaked than a Gaussian (red dashed line) and is best described by a Student’s t-distribution with ν = 4.3, and a width σ = 0.08 with zero mean (black solid line).
Current usage metrics show cumulative count of Article Views (full-text article views including HTML views, PDF and ePub downloads, according to the available data) and Abstracts Views on Vision4Press platform.
Data correspond to usage on the plateform after 2015. The current usage metrics is available 48-96 hours after online publication and is updated daily on week days.
Initial download of the metrics may take a while.