Fig. F.1.
Download original image
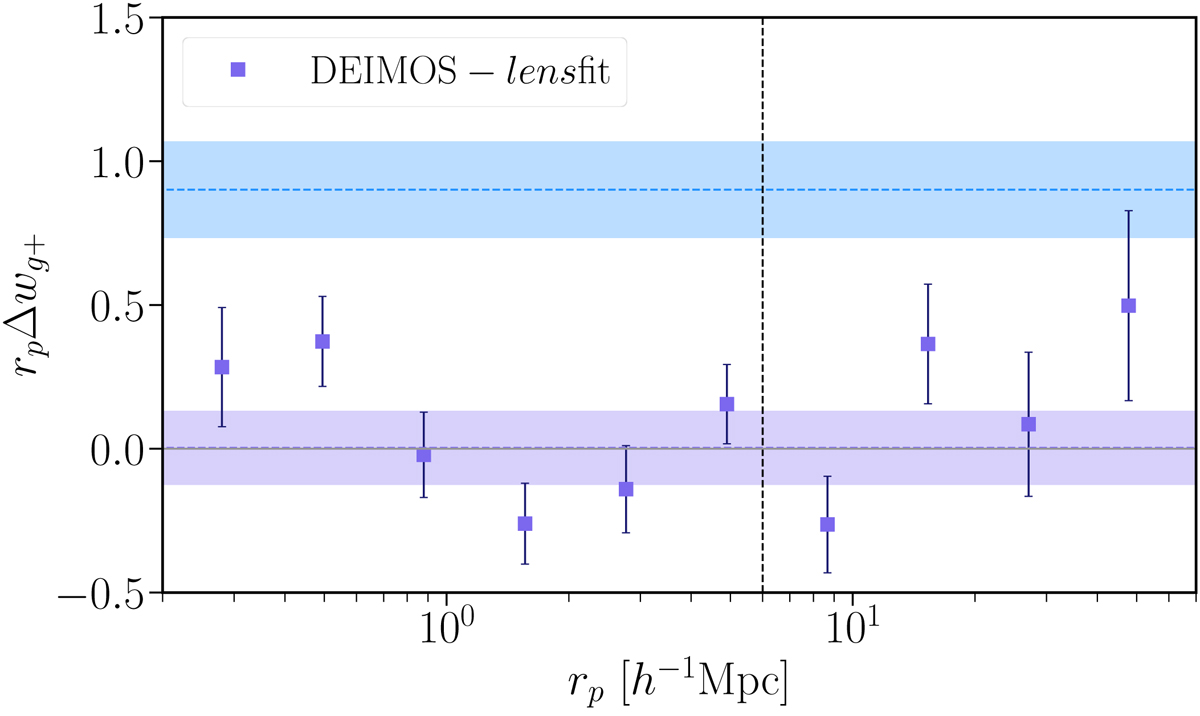
Difference in the wg+ measurements as measured by DEIMOS and lensfit. The indigo dashed line shows the best-fit amplitude of the difference, here parametrised as A/rp. Similarly, the light blue dashed line illustrates the best-fit amplitude for the DEIMOS sample, both performed for rp > 6 h−1 Mpc. The shaded areas delimit the 1σ contour of the fit.
Current usage metrics show cumulative count of Article Views (full-text article views including HTML views, PDF and ePub downloads, according to the available data) and Abstracts Views on Vision4Press platform.
Data correspond to usage on the plateform after 2015. The current usage metrics is available 48-96 hours after online publication and is updated daily on week days.
Initial download of the metrics may take a while.