Fig. 10.
Download original image
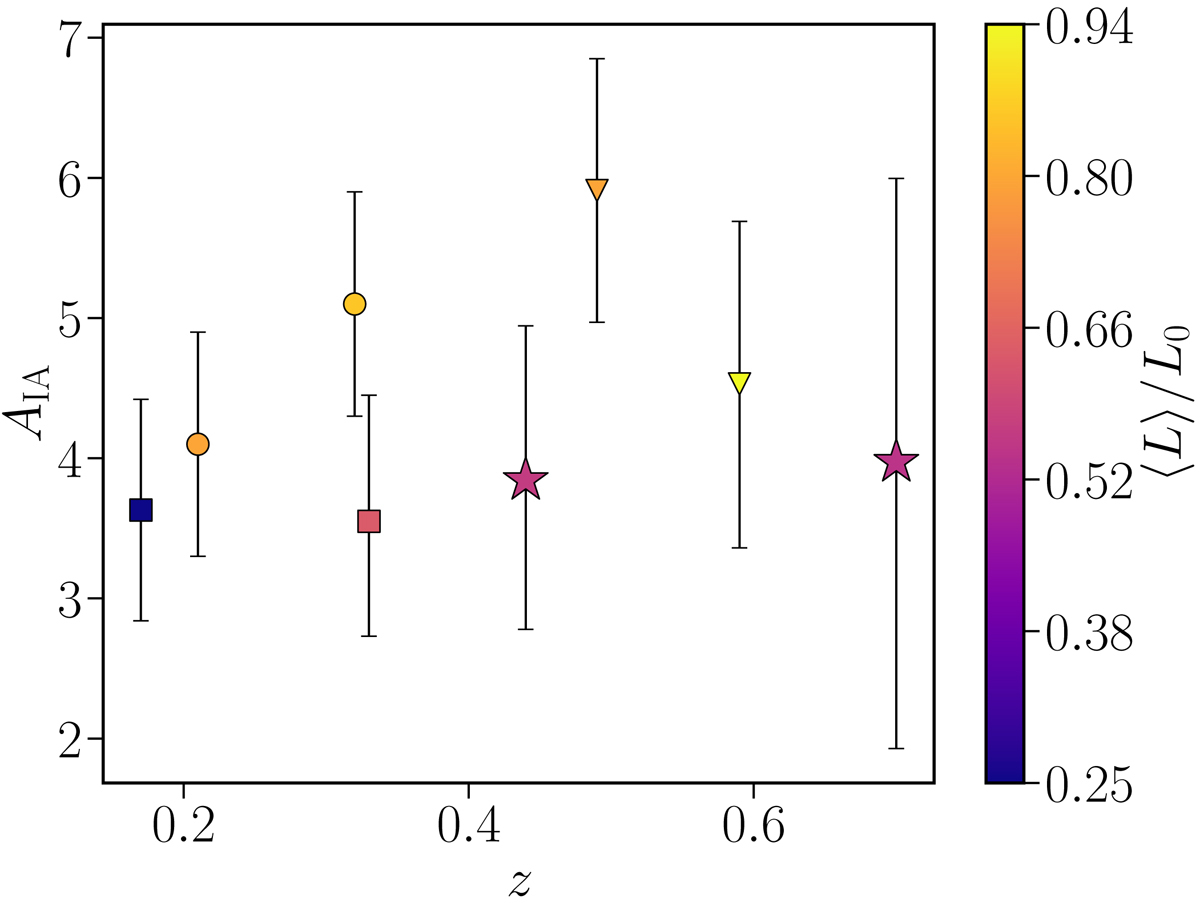
Intrinsic alignment amplitude, AIA, as a function of redshift and luminosity for different best-fit values in the literature. Different markers refer to different studies and are colour-coded based on their luminosity: MegaZ (Joachimi et al. 2011) is shown as triangles, LOWZ (Singh et al. 2015) as circles, GAMA (Johnston et al. 2019) as squares and the LRG luminous sample Z1 and Z2 as stars.
Current usage metrics show cumulative count of Article Views (full-text article views including HTML views, PDF and ePub downloads, according to the available data) and Abstracts Views on Vision4Press platform.
Data correspond to usage on the plateform after 2015. The current usage metrics is available 48-96 hours after online publication and is updated daily on week days.
Initial download of the metrics may take a while.