Fig. 7.
Download original image
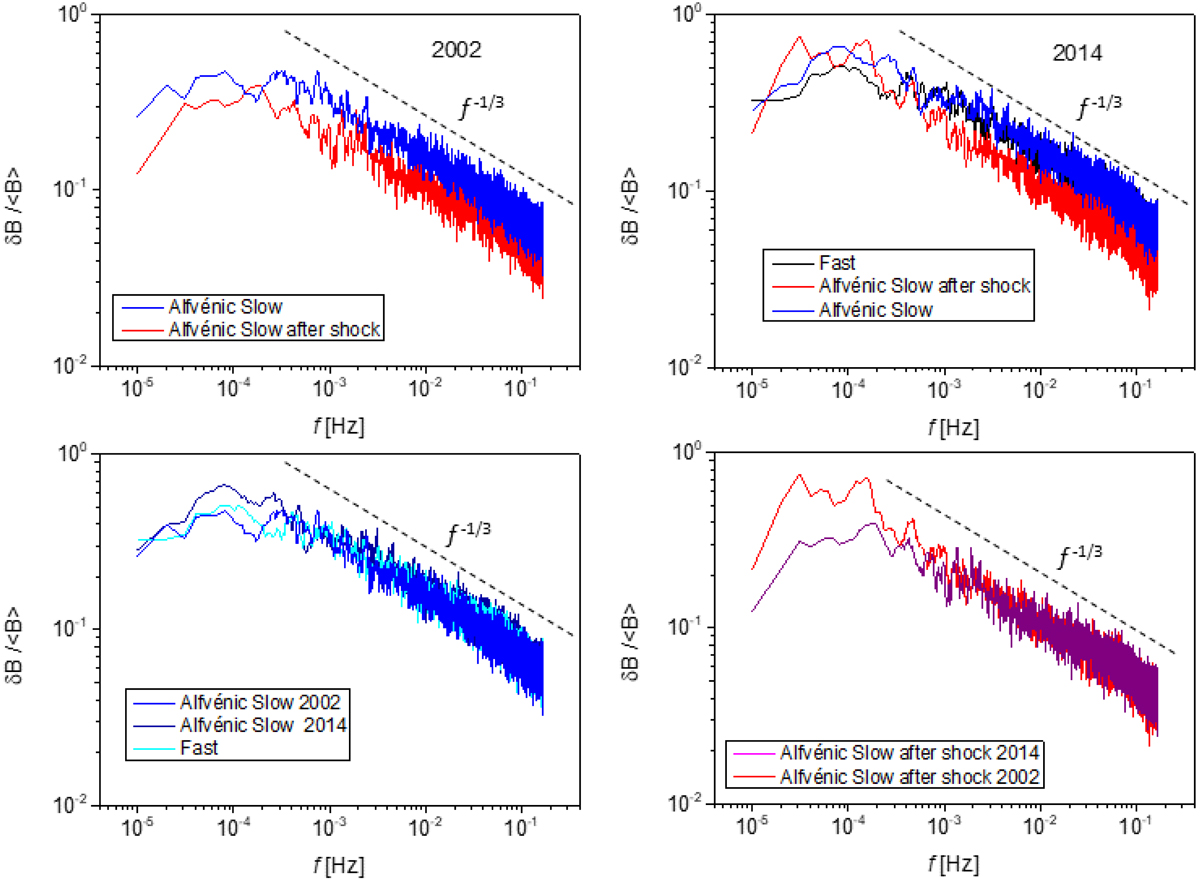
Normalized power spectral density of the trace of magnetic field components, δB/⟨B⟩, as described in the text, of the shaded gray intervals selected in Fig. 6. Upper panels: comparison between different solar wind regimes for years 2002 (left) and 2014 (right), with the red and blue lines identifying the Alfvénic slow wind intervals that are either preceded (events “2”) by a shock or not (events “1”), respectively. The black line refers to the “fast” solar wind. Lower panels: same spectra as in the upper panels, but they are grouped in a different way: Alfvénic winds are characterized by a higher amplitude of the fluctuations on the left (blue and royal blue referring to the events in 2002 and 2014, respectively, and cyan referring to the fast wind interval) and Alfvénic slow wind intervals preceded by a shock are characterized by lower spectra on the right (red and magenta referring to the events in 2002 and 2014, respectively). The dashed line corresponds to the Kolmogorov scaling (PB(f)∼f−5/3) represented by a scaling of δB(f)∼f−1/3, according to the normalization described in the text.
Current usage metrics show cumulative count of Article Views (full-text article views including HTML views, PDF and ePub downloads, according to the available data) and Abstracts Views on Vision4Press platform.
Data correspond to usage on the plateform after 2015. The current usage metrics is available 48-96 hours after online publication and is updated daily on week days.
Initial download of the metrics may take a while.