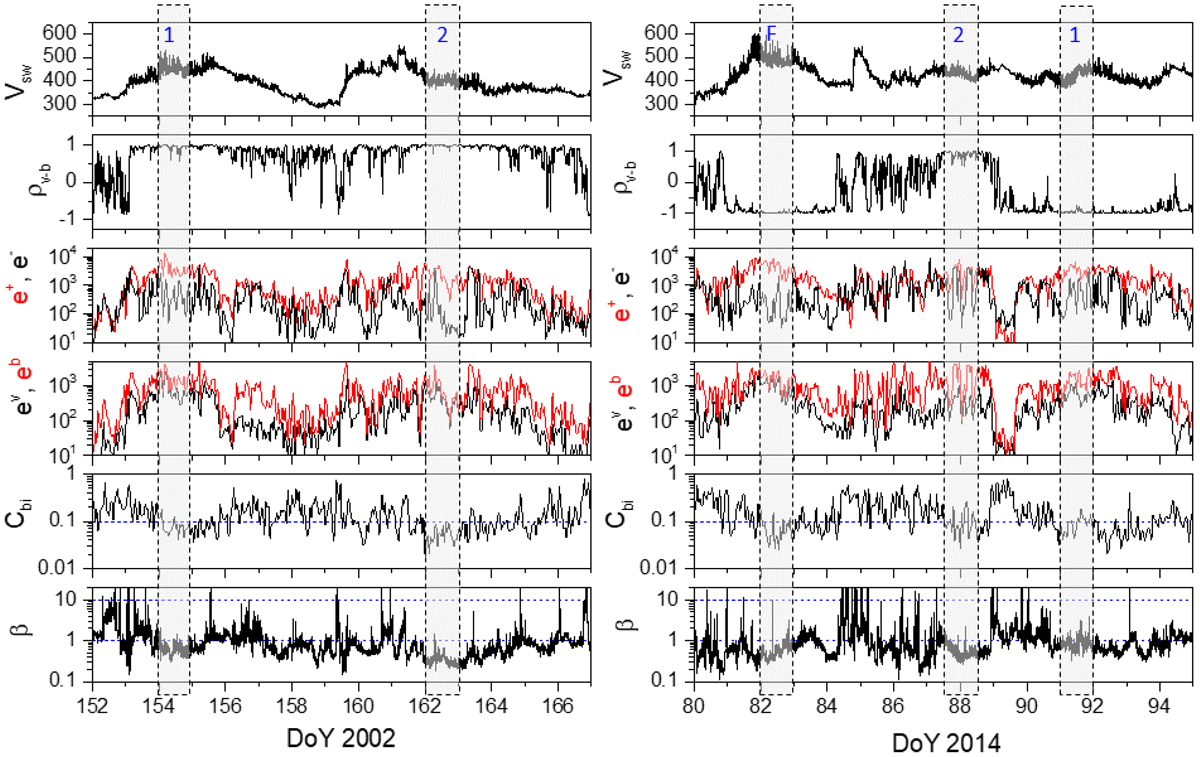
Fig. 6.
Download original image
Comparison of case studies between the maximum of SC23 (left panels) and SC24 (rights panels). From top to bottom: time series of the following: solar wind speed, Vsw in km s−1; v − b correlation coefficient, ρv − b, computed at a 1 h scale; energy associated to z+ and z− modes, e+ (red) and e− (black) in km2 s−2 (energy per unit mass), respectively, computed at a 1 h scale; kinetic and magnetic energy, ev (black) and eb (red) in km2 s−2 (energy per unit mass), computed at a 1 h scale; magnetic compressibility, Cbi; and plasma beta, β. The shaded gray boxes indicate a one-day interval within the Alfvénic solar wind streams highlighted in Fig. 5.
Current usage metrics show cumulative count of Article Views (full-text article views including HTML views, PDF and ePub downloads, according to the available data) and Abstracts Views on Vision4Press platform.
Data correspond to usage on the plateform after 2015. The current usage metrics is available 48-96 hours after online publication and is updated daily on week days.
Initial download of the metrics may take a while.