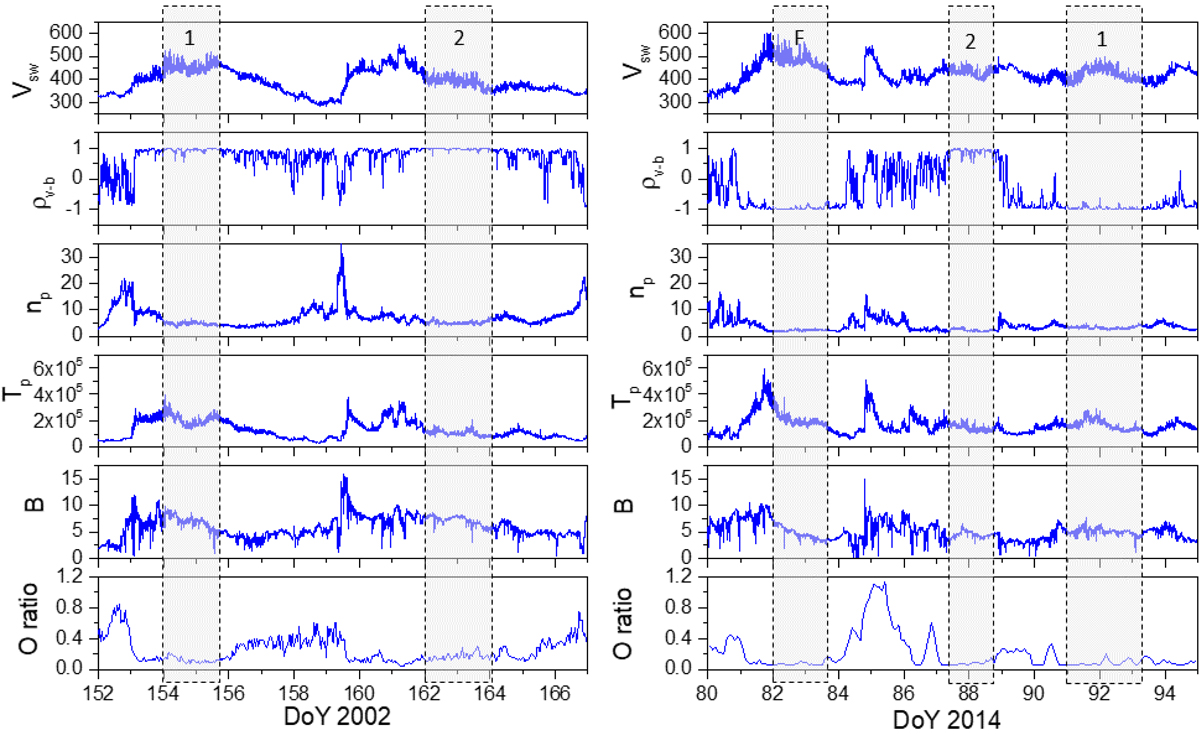
Fig. 5.
Download original image
Comparison of case studies between the maximum of SC23 (left panels) and SC24 (right panels). From top to bottom: time series of the following: solar wind speed, Vsw in km s−1; v − b correlation coefficient, ρv − b computed at 1 h scale; proton number density, np in cm−3; proton average temperature, Tp in K; magnetic field magnitude, B in nT; and oxygen charge state ratio, O+7/O+6 indicated as O ratio. The shaded gray boxes indicate the following Alfvénic solar wind intervals: slow wind (events “1” and “2”, explanation in the text) and faster wind (marked as “F”).
Current usage metrics show cumulative count of Article Views (full-text article views including HTML views, PDF and ePub downloads, according to the available data) and Abstracts Views on Vision4Press platform.
Data correspond to usage on the plateform after 2015. The current usage metrics is available 48-96 hours after online publication and is updated daily on week days.
Initial download of the metrics may take a while.