Free Access
Fig. 4.
Download original image
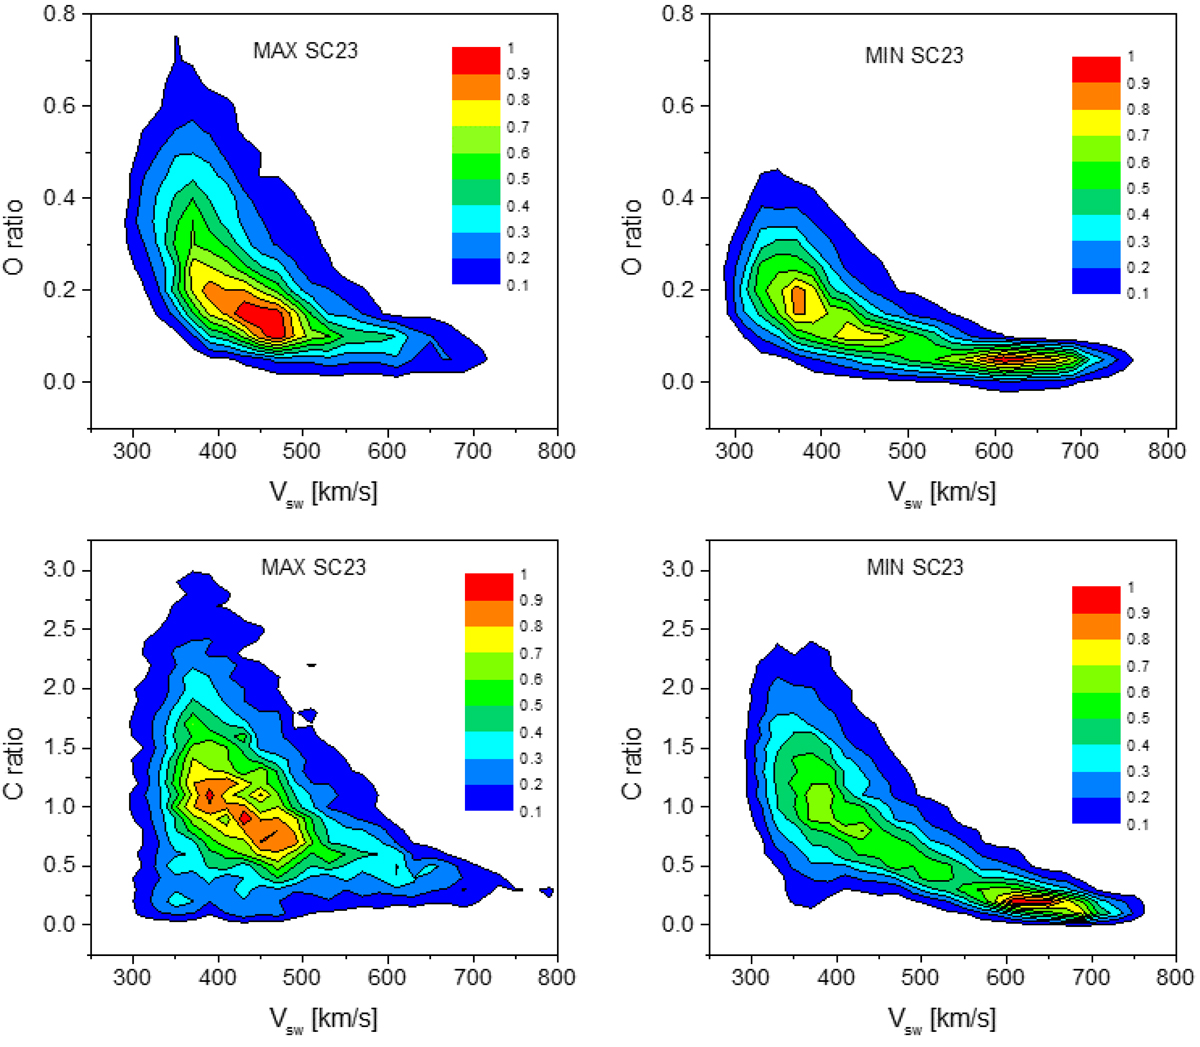
2D histograms of O (upper panels) and C ratios (lower panels) versus flow speed for maximum (left panels) and minimum (right panels) of SC 23. The color scale indicates the percentage of occurrences with respect to the maximum value with the lowest value corresponding to 10%.
Current usage metrics show cumulative count of Article Views (full-text article views including HTML views, PDF and ePub downloads, according to the available data) and Abstracts Views on Vision4Press platform.
Data correspond to usage on the plateform after 2015. The current usage metrics is available 48-96 hours after online publication and is updated daily on week days.
Initial download of the metrics may take a while.