Free Access
Fig. 1.
Download original image
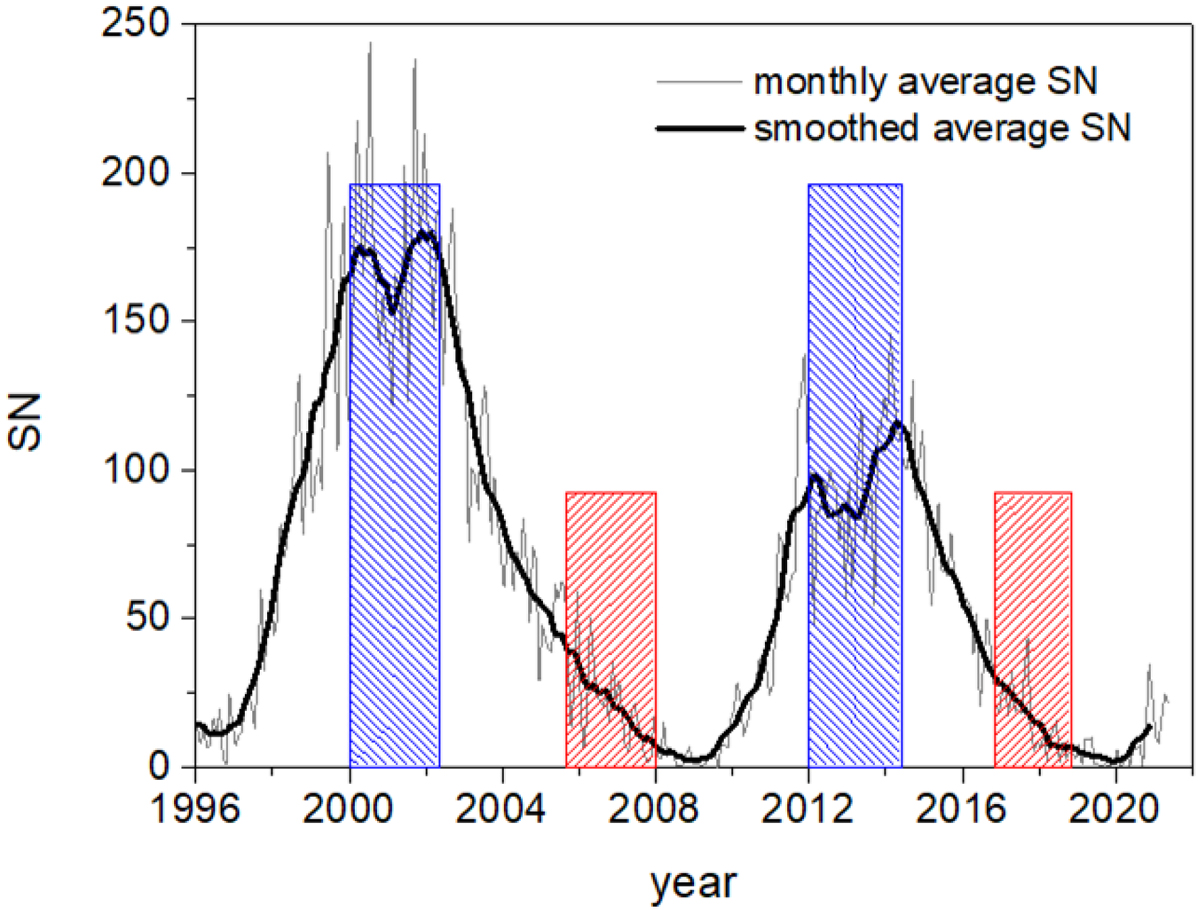
Monthly sunspot number (SN) as a function of time (gray line) and smoothed average (black line) during solar cycles 23 and 24. The dashed colored boxes indicate the selected 30-month intervals: blue for solar maximum and red for solar minimum.
Current usage metrics show cumulative count of Article Views (full-text article views including HTML views, PDF and ePub downloads, according to the available data) and Abstracts Views on Vision4Press platform.
Data correspond to usage on the plateform after 2015. The current usage metrics is available 48-96 hours after online publication and is updated daily on week days.
Initial download of the metrics may take a while.