Fig. 9.
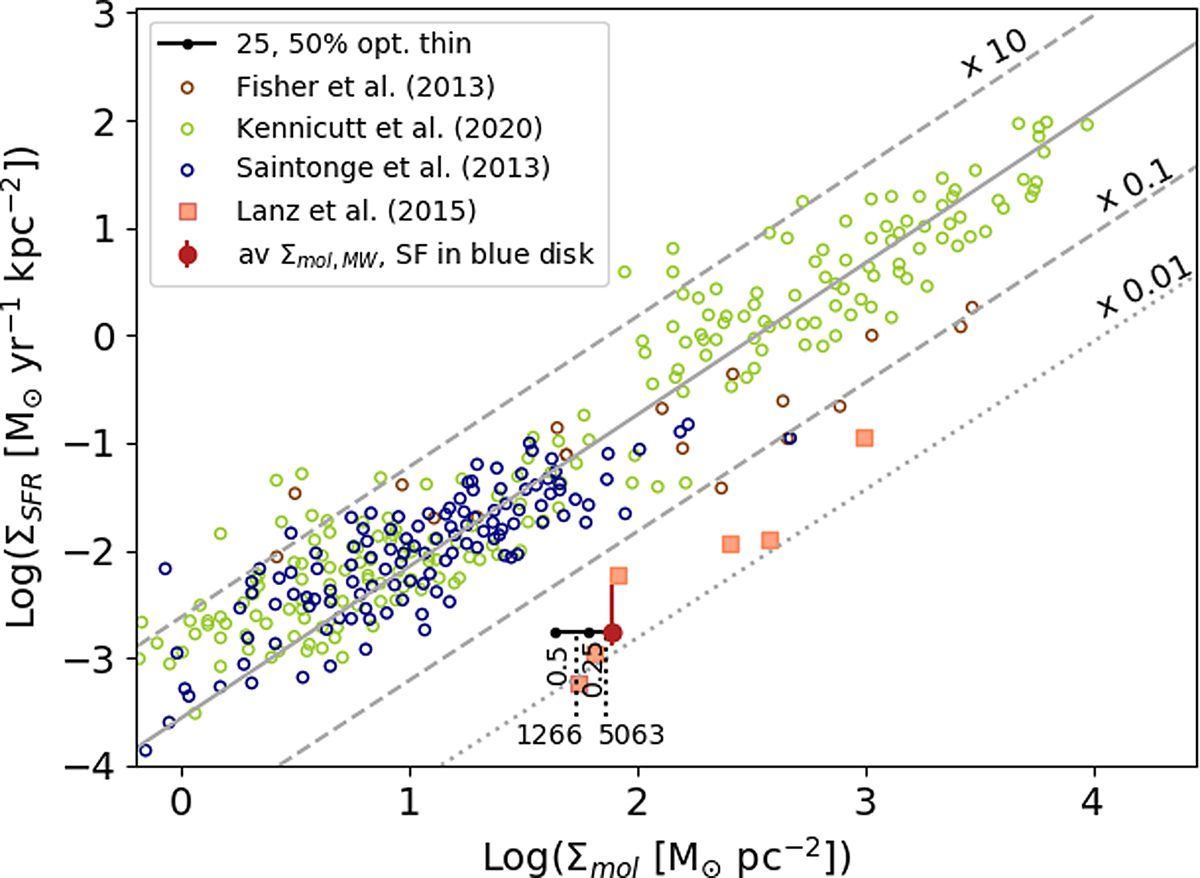
Download original image
Star-formation rate surface density as a function of molecular gas-mass surface density in J2345−0449. The red dot indicates the position of J2345−0449 for the average gas mass and star-formation rate surface densities, Σgas = 78 M⊙ pc2 and ΣSFR = 1.9 × 10⁻³ M⊙ yr−1 kpc−2, respectively. Small black dots indicate the position of the source if 25% or 50% of the CO(1−0) line flux come from optically thin gas. Dotted vertical lines indicate the correction that would be necessary if J2345−0449 had the same fraction of optically thin gas as NGC 1266 and IC 5063. The error bar in star-formation rate takes into account the systematic differences between star-formation rate tracers discussed in Sect. 3.3, including in particular the SFR = 2.95 M⊙ yr−1 estimated from WISE at 22 μm by Dabhade et al. (2020).
Current usage metrics show cumulative count of Article Views (full-text article views including HTML views, PDF and ePub downloads, according to the available data) and Abstracts Views on Vision4Press platform.
Data correspond to usage on the plateform after 2015. The current usage metrics is available 48-96 hours after online publication and is updated daily on week days.
Initial download of the metrics may take a while.