Open Access
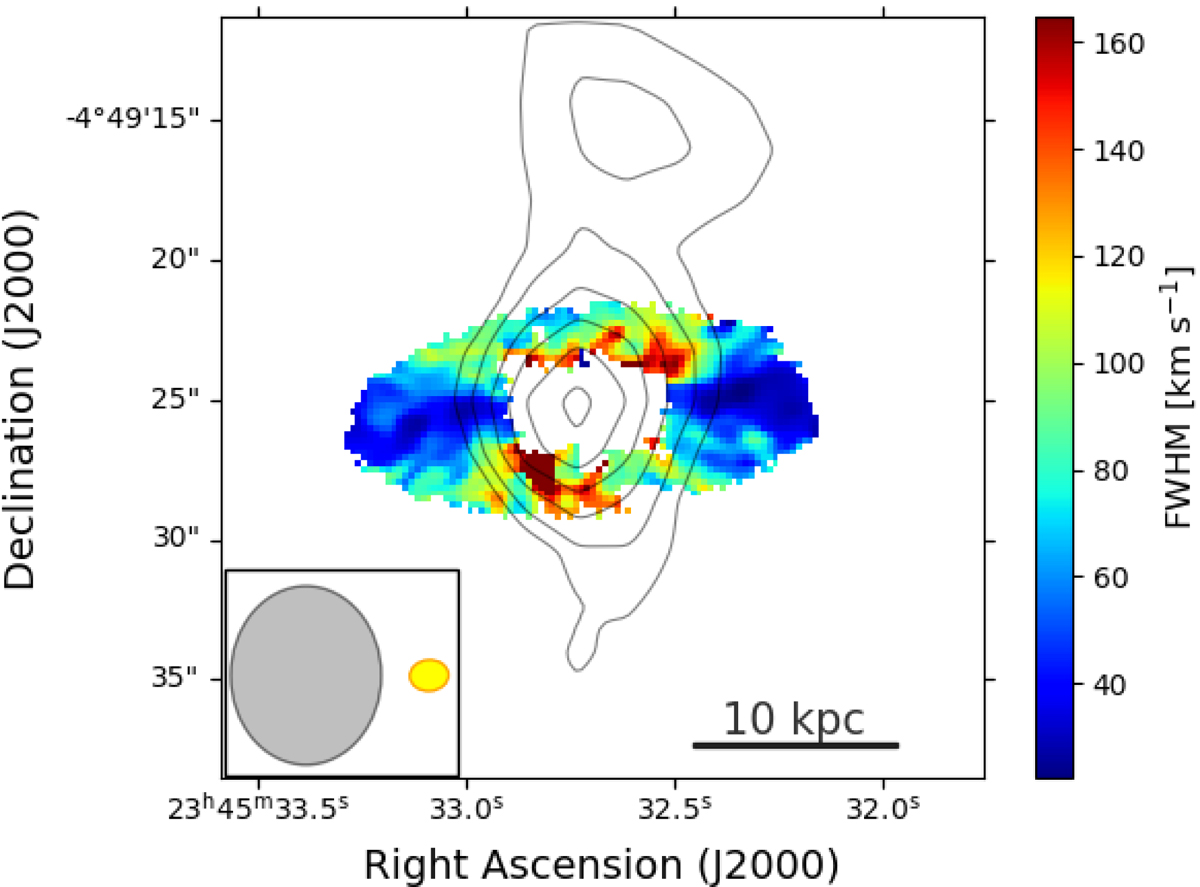
Fig. 8.
Download original image
Map of FWHMs obtained with ALMA shown as color image, with the 1.4 GHz radio morphology observed with FIRST overplotted as contours. The region of strong line broadening of CO coincides well with the position angle of the radio source.
Current usage metrics show cumulative count of Article Views (full-text article views including HTML views, PDF and ePub downloads, according to the available data) and Abstracts Views on Vision4Press platform.
Data correspond to usage on the plateform after 2015. The current usage metrics is available 48-96 hours after online publication and is updated daily on week days.
Initial download of the metrics may take a while.