Fig. 2.
Download original image
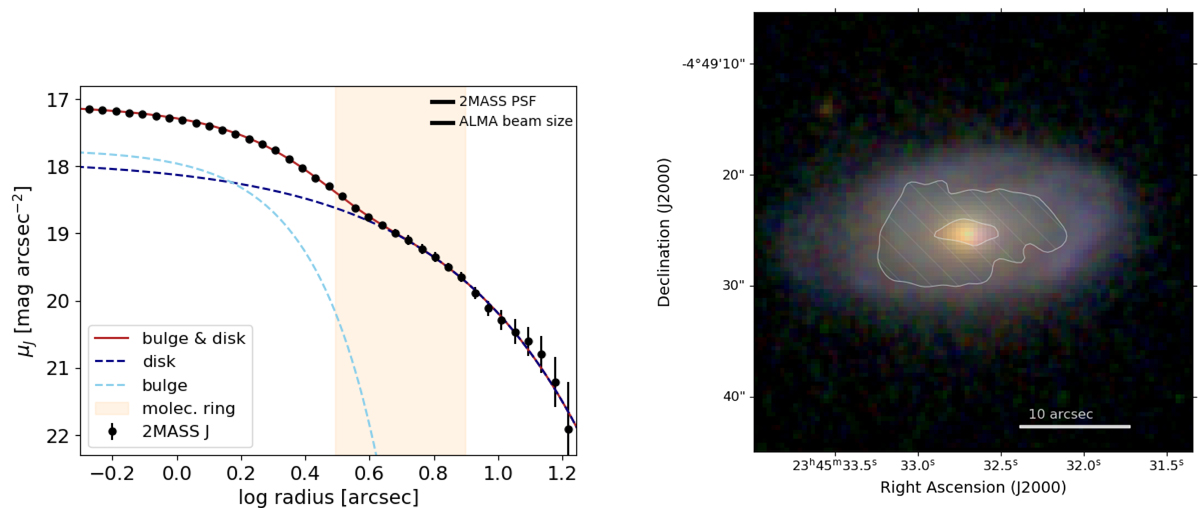
Left: Azimuthally averaged surface brightness profile of J2345−0449 extracted from the 2MASS J-band image. The dark and light blue components show individual fits to the disk and bulge component, respectively. The red line shows the combined fit. Both Sersic components were also convolved with a Gaussian kernel with FWHM = 0.96″, corresponding to the size of the seeing disk in the 2MASS data. The light orange area shows the radii where CO(1−0) line emission is detected in the ALMA data. Right: SDSS three-color image of J2345−0449, showing the galaxy in the g, r, and i-bands. The hatched area shows where CO(1−0) line emission is detected with ALMA at ≥3× the rms. North is up, east to the left.
Current usage metrics show cumulative count of Article Views (full-text article views including HTML views, PDF and ePub downloads, according to the available data) and Abstracts Views on Vision4Press platform.
Data correspond to usage on the plateform after 2015. The current usage metrics is available 48-96 hours after online publication and is updated daily on week days.
Initial download of the metrics may take a while.