Fig. 10.
Download original image
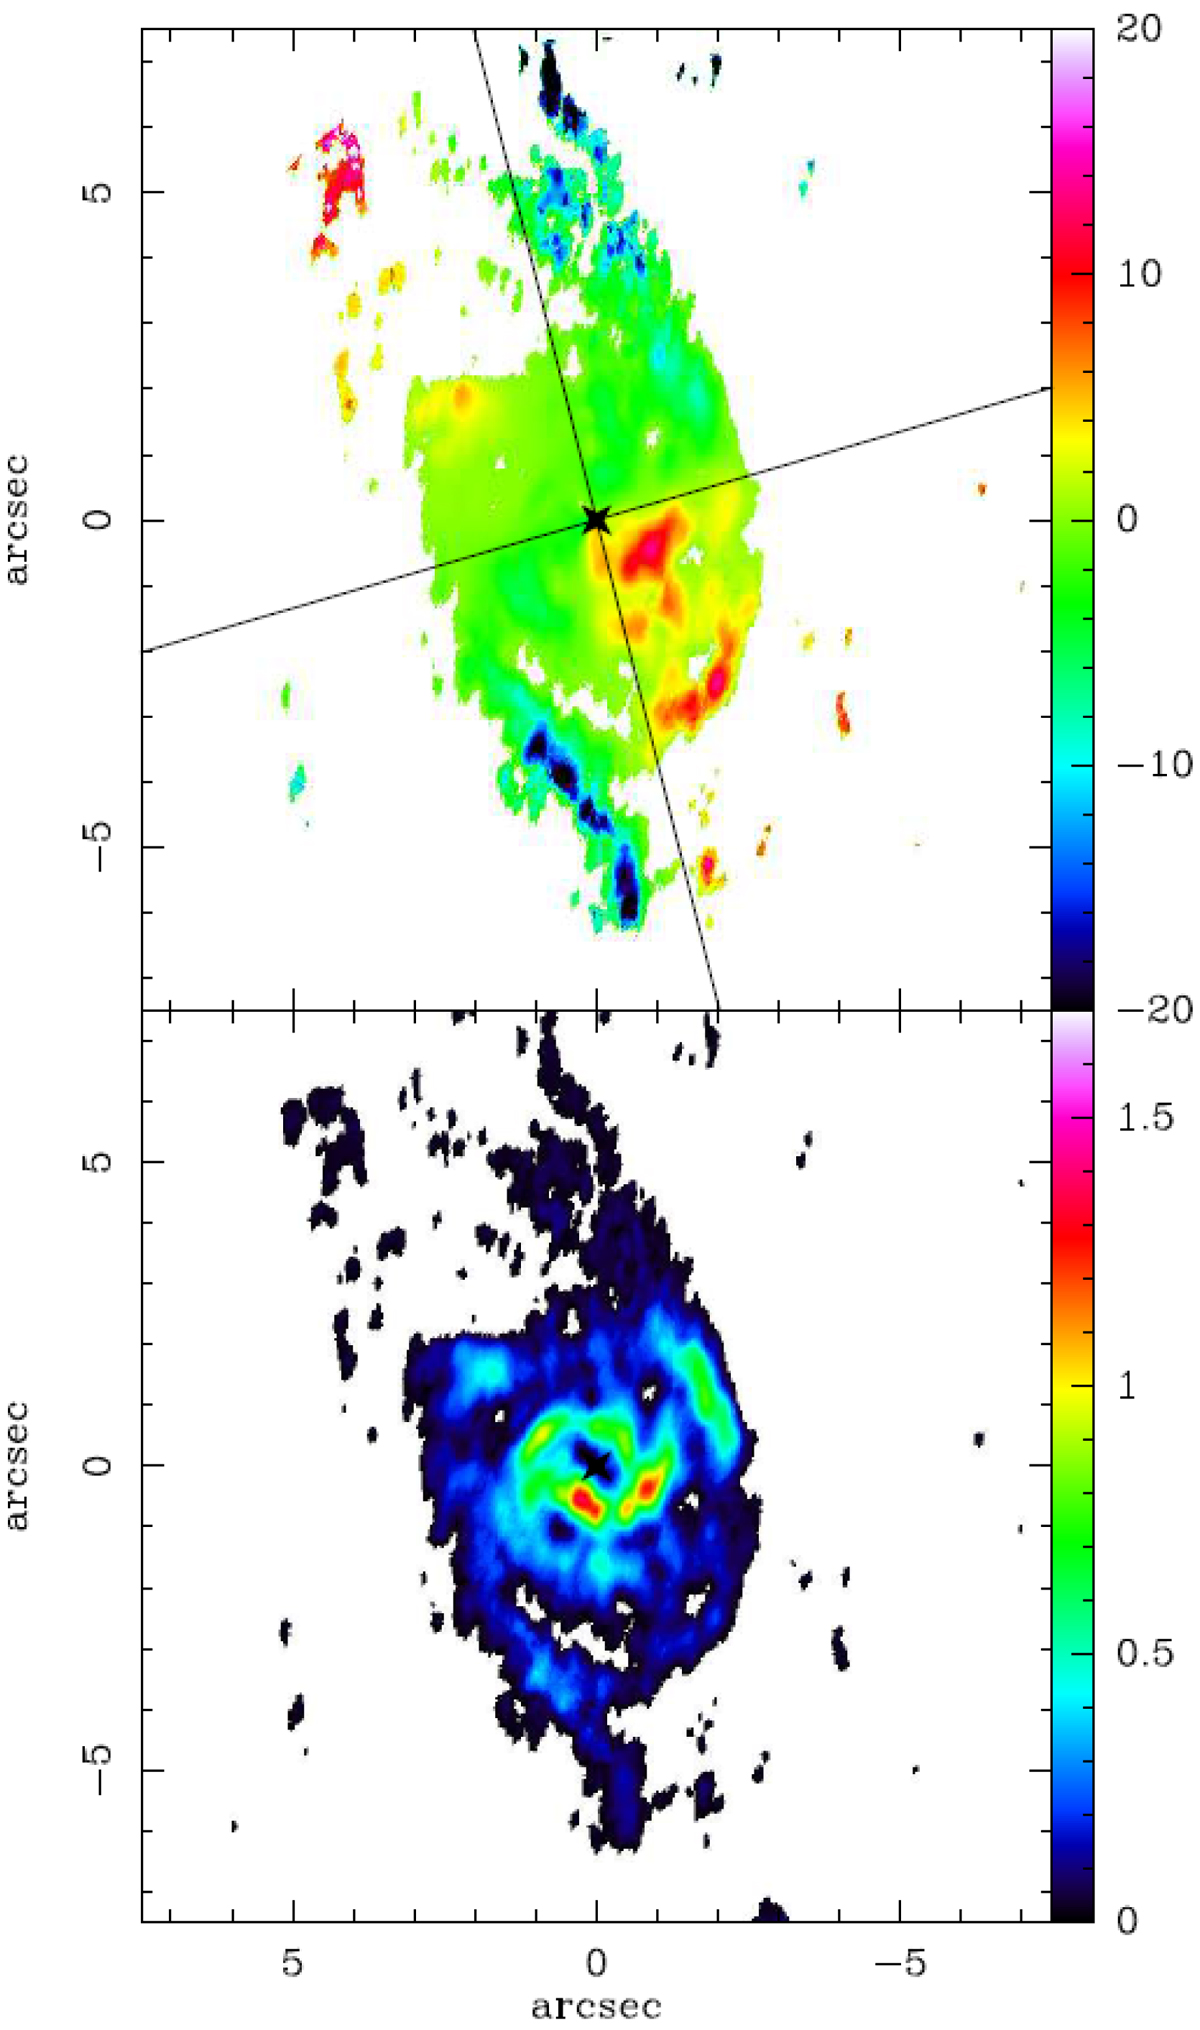
Top panel: map of the gravitational torques exerted on the gas by the stellar potential in the centre of NGC 4968. The map shows in each pixel the torque derived from the HST-NIR image multiplied by the gas surface density. Both images have been de-projected to face-on (see text for details). The torques change sign as expected in a four-quadrant pattern (or butterfly diagram). The orientation of the quadrants follows the bar orientation. In this de-projected picture, the major axis of the galaxy is orientated parallel to the horizontal axis. Bottom panel: de-projected image of the CO(2−1) emission, at the same scale and with the same orientation, for comparison.
Current usage metrics show cumulative count of Article Views (full-text article views including HTML views, PDF and ePub downloads, according to the available data) and Abstracts Views on Vision4Press platform.
Data correspond to usage on the plateform after 2015. The current usage metrics is available 48-96 hours after online publication and is updated daily on week days.
Initial download of the metrics may take a while.