Fig. 1.
Download original image
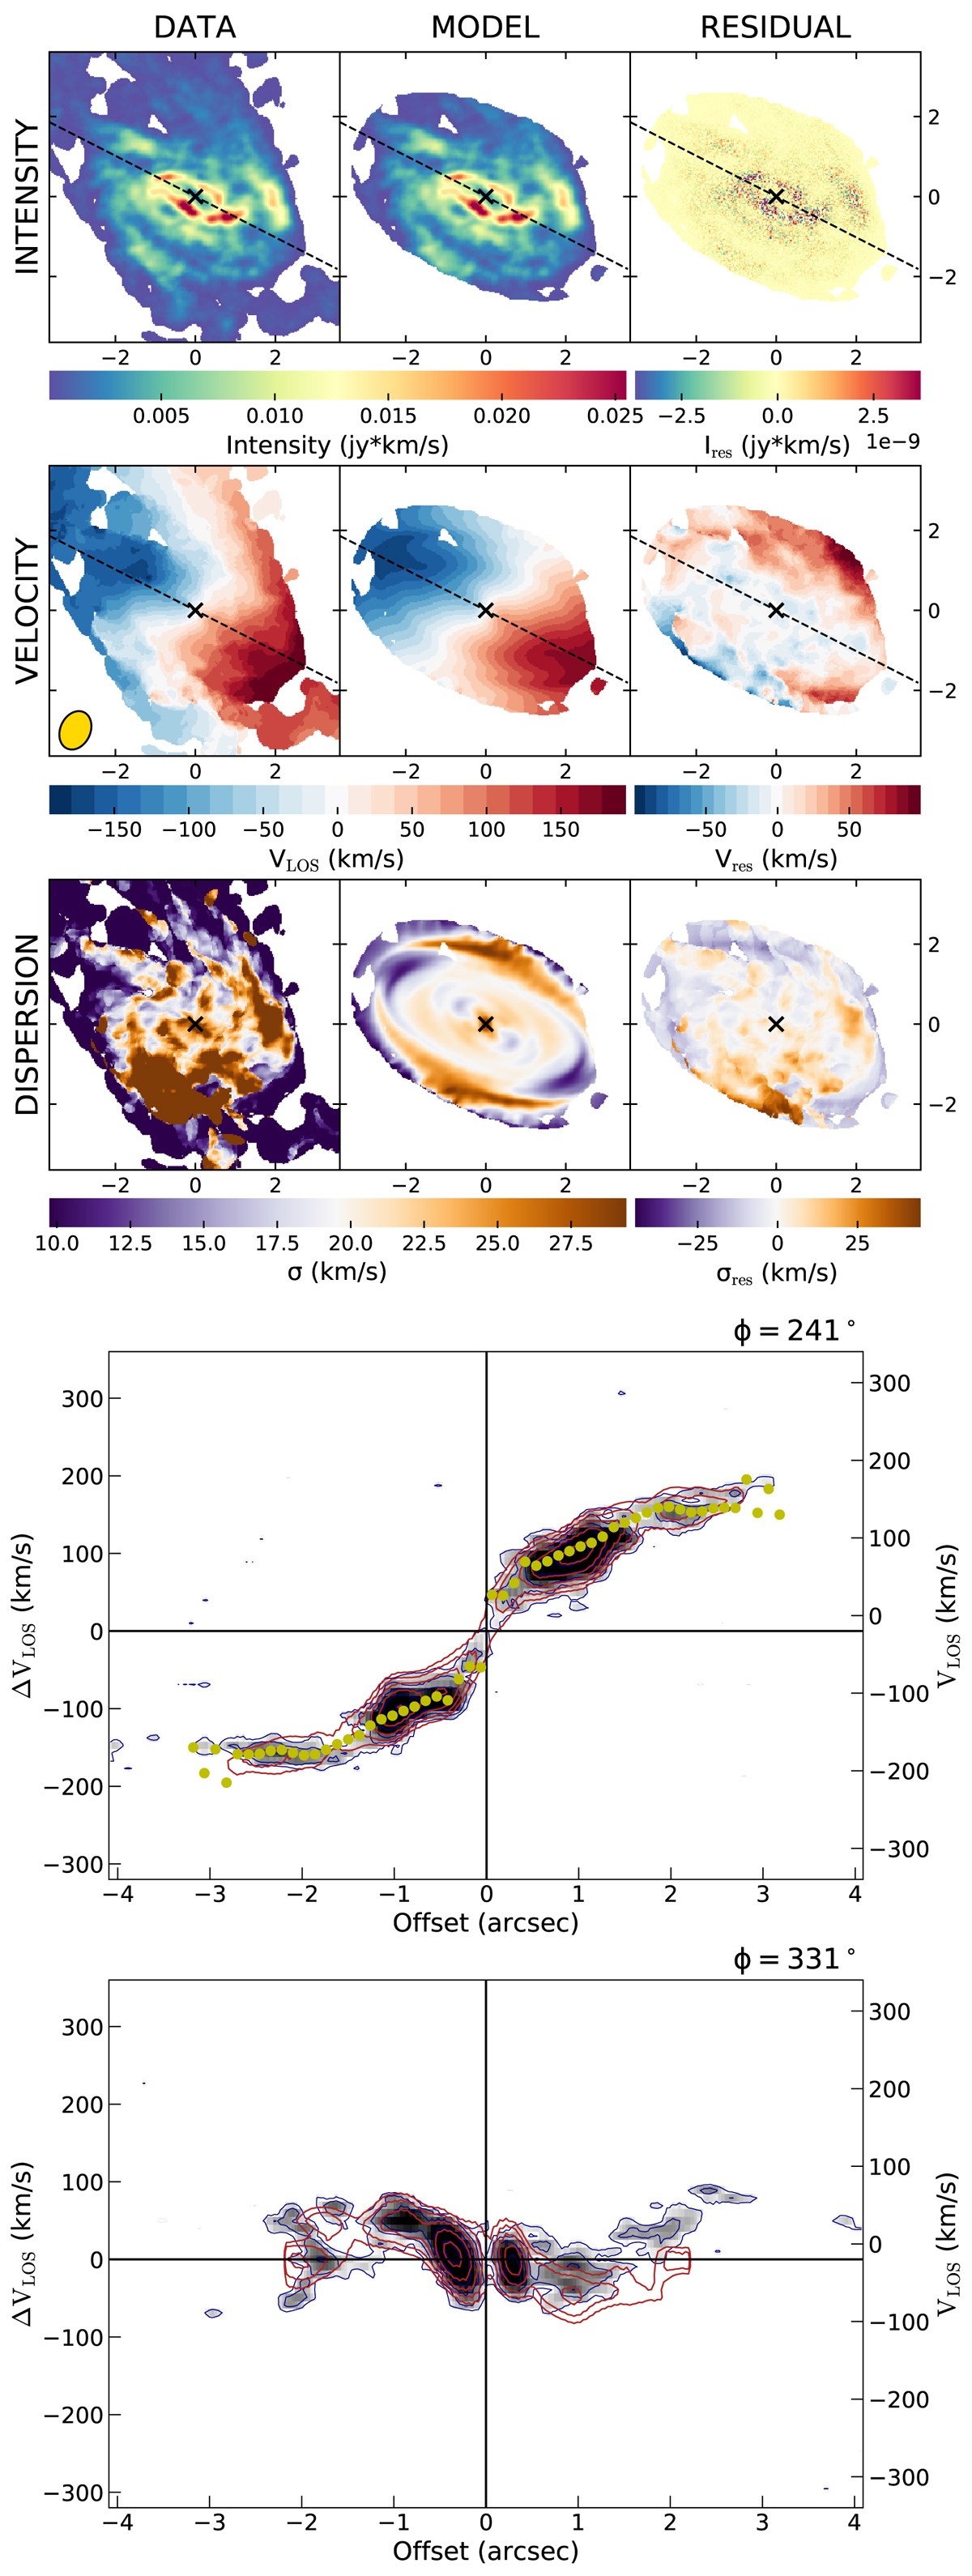
Top panels: (from top to bottom; left panels): zeroth (intensity), first (velocity field), and second (velocity dispersion) moment maps of the ALMA CO(2−1) data of NGC 4968. Central panels: same as the left panels but for the best-fit model constructed with 3D BAROLO. Right panels: same as the left panels but for the residual (data model). The black cross denotes the centre of the galaxy. The major axis of the molecular disc is shown by a dashed black line in the velocity map. The yellow ellipse in the bottom left corner of the data velocity map shows the synthesised beam size (0.27″ × 0.22″) with PA = 245°. North and east directions correspond to top and left, respectively. Bottom panels: p − v diagrams extracted from the data cube (solid blue contours) and model cube (solid red contours) along the major axis (top panel) and along the minor axis (bottom panel). The contours level of both the data and the model are at [1,2,4,8,16,32,64]*l, where l = 0.0012. The rotation velocity of each ring of the best-fit disc model is represented by the solid yellow dots in the top panel.
Current usage metrics show cumulative count of Article Views (full-text article views including HTML views, PDF and ePub downloads, according to the available data) and Abstracts Views on Vision4Press platform.
Data correspond to usage on the plateform after 2015. The current usage metrics is available 48-96 hours after online publication and is updated daily on week days.
Initial download of the metrics may take a while.