Fig. B.1.
Download original image
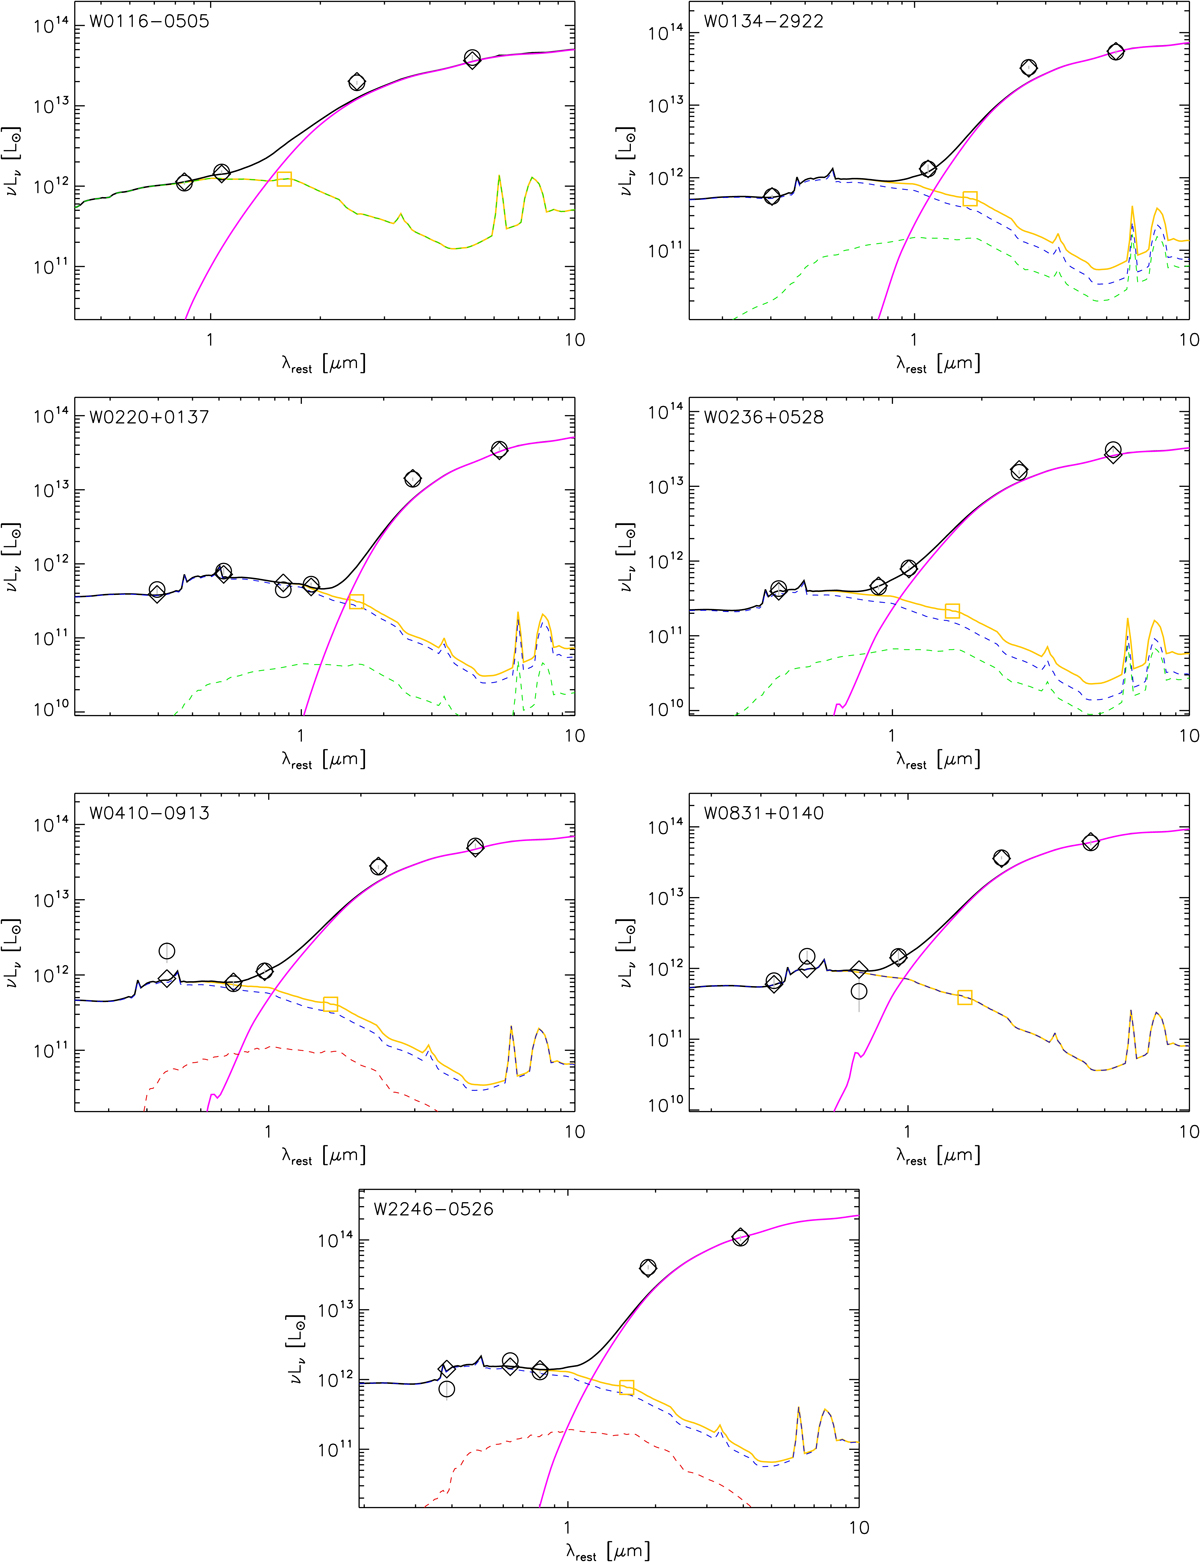
Results from the SED fitting. The photometric data of the sources are shown as black open circles. The AGN component is shown as a pink, solid line, while the E, Sbc and Im galaxy templates are displayed as red, green and blue dashed lines, respectively. The SED of the host galaxy (E + Sbc + Im) is shown as a yellow solid line, while the total SED of the source (including the AGN component) is displayed as a black solid line, with the synthetic photometry obtained from it (filter-convolved, color-corrected) shown as black open diamonds. The H-band flux of the host, used to obtain its stellar mass via scaling with a [M/L]H ratio (see text), is shown as a yellow open square.
Current usage metrics show cumulative count of Article Views (full-text article views including HTML views, PDF and ePub downloads, according to the available data) and Abstracts Views on Vision4Press platform.
Data correspond to usage on the plateform after 2015. The current usage metrics is available 48-96 hours after online publication and is updated daily on week days.
Initial download of the metrics may take a while.