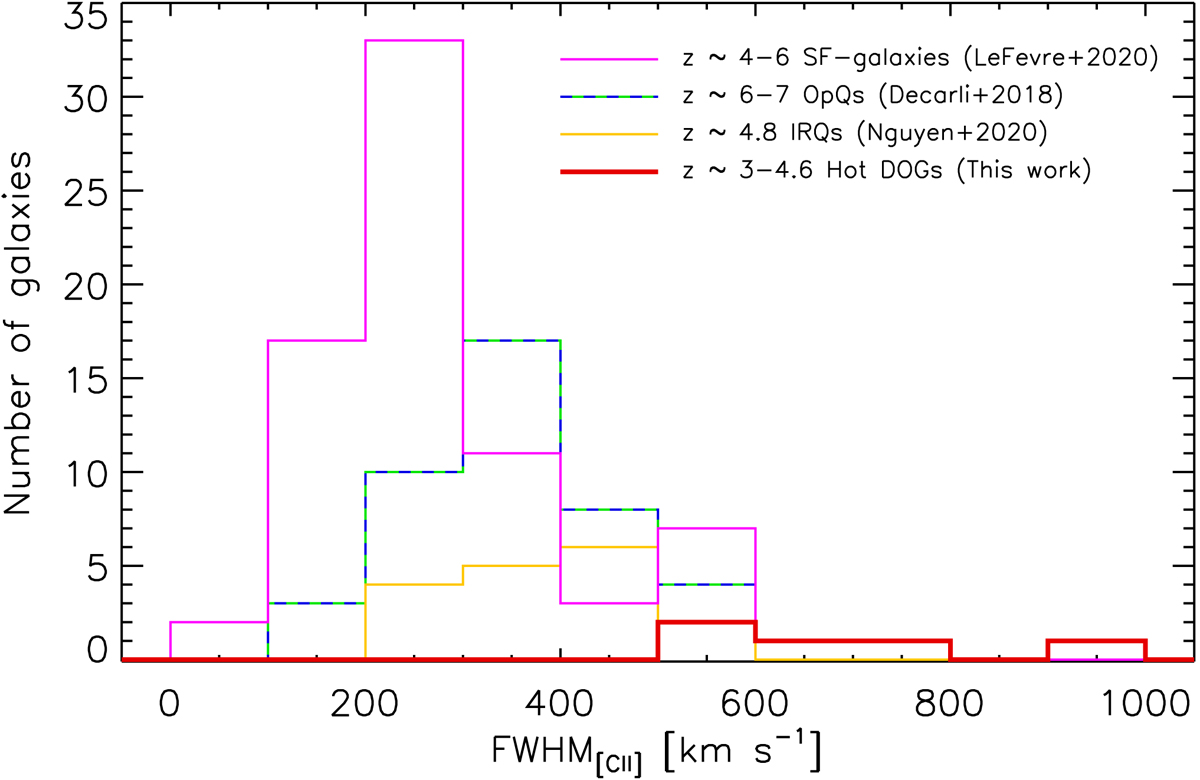
Fig. 11.
Download original image
Histogram of the [C II] FWHM for the sample of Hot DOGs (red line). The z ≃ 4.7 IRQs from Trakhtenbrot et al. (2017) and Nguyen et al. (2020) are shown in yellow. The compilation of z ≳ 6 OpQs from Decarli et al. (2018) is displayed as a green/blue dashed line. The 4 ≲ z ≲ 6 star-forming galaxies from Le Fèvre et al. (2020) are shown in pink.
Current usage metrics show cumulative count of Article Views (full-text article views including HTML views, PDF and ePub downloads, according to the available data) and Abstracts Views on Vision4Press platform.
Data correspond to usage on the plateform after 2015. The current usage metrics is available 48-96 hours after online publication and is updated daily on week days.
Initial download of the metrics may take a while.