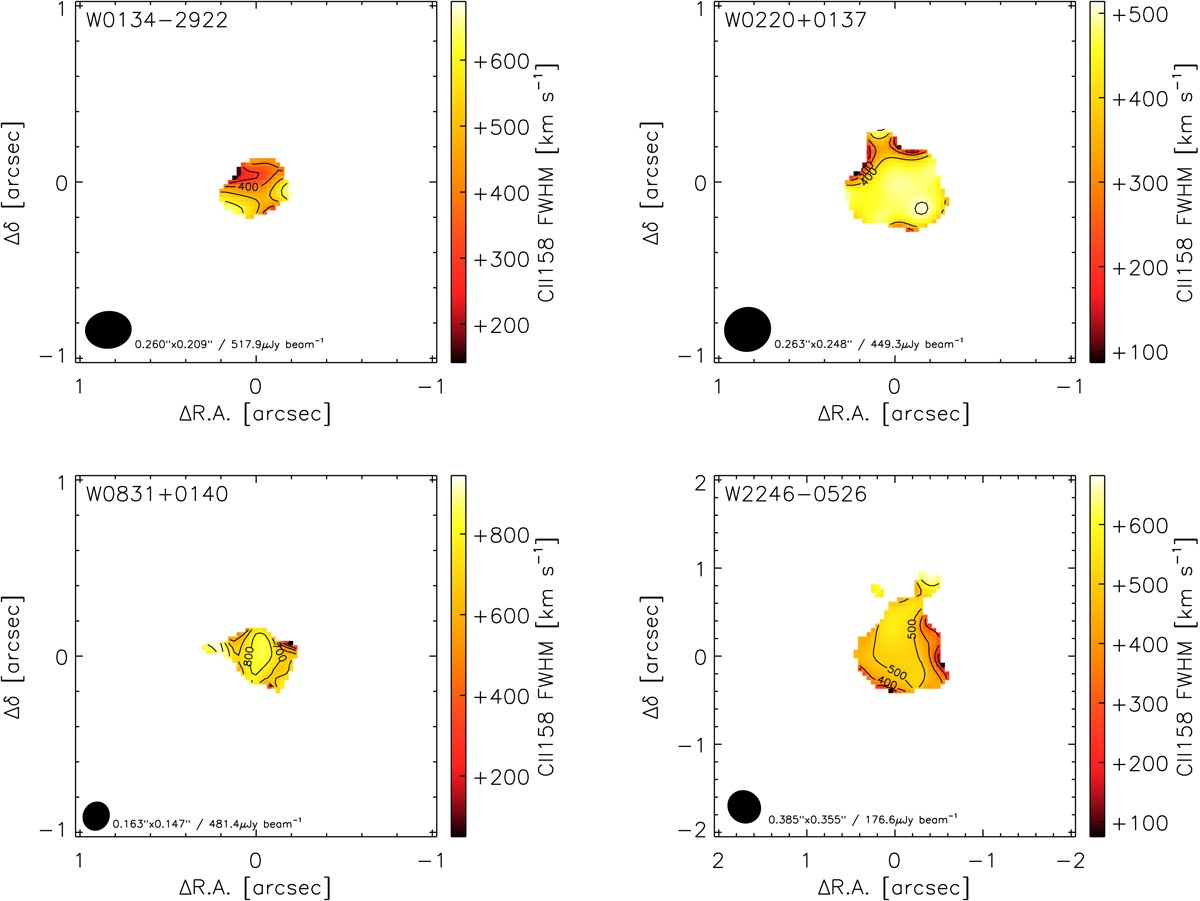
Fig. 10.
Download original image
[C II] FWHM (moment 2) maps down to a 3σ level (see contours in Fig. 7). The beam is shown as a black ellipse on the bottom-left, together with its size and the depth (rms) of the reference SPW used to create the map. Contour levels are drawn at [0, 25, 50, 100, 200, 300…] km s−1. The FoVs are the same as in Fig. 6 to facilitate the comparison.
Current usage metrics show cumulative count of Article Views (full-text article views including HTML views, PDF and ePub downloads, according to the available data) and Abstracts Views on Vision4Press platform.
Data correspond to usage on the plateform after 2015. The current usage metrics is available 48-96 hours after online publication and is updated daily on week days.
Initial download of the metrics may take a while.