Fig. 2.
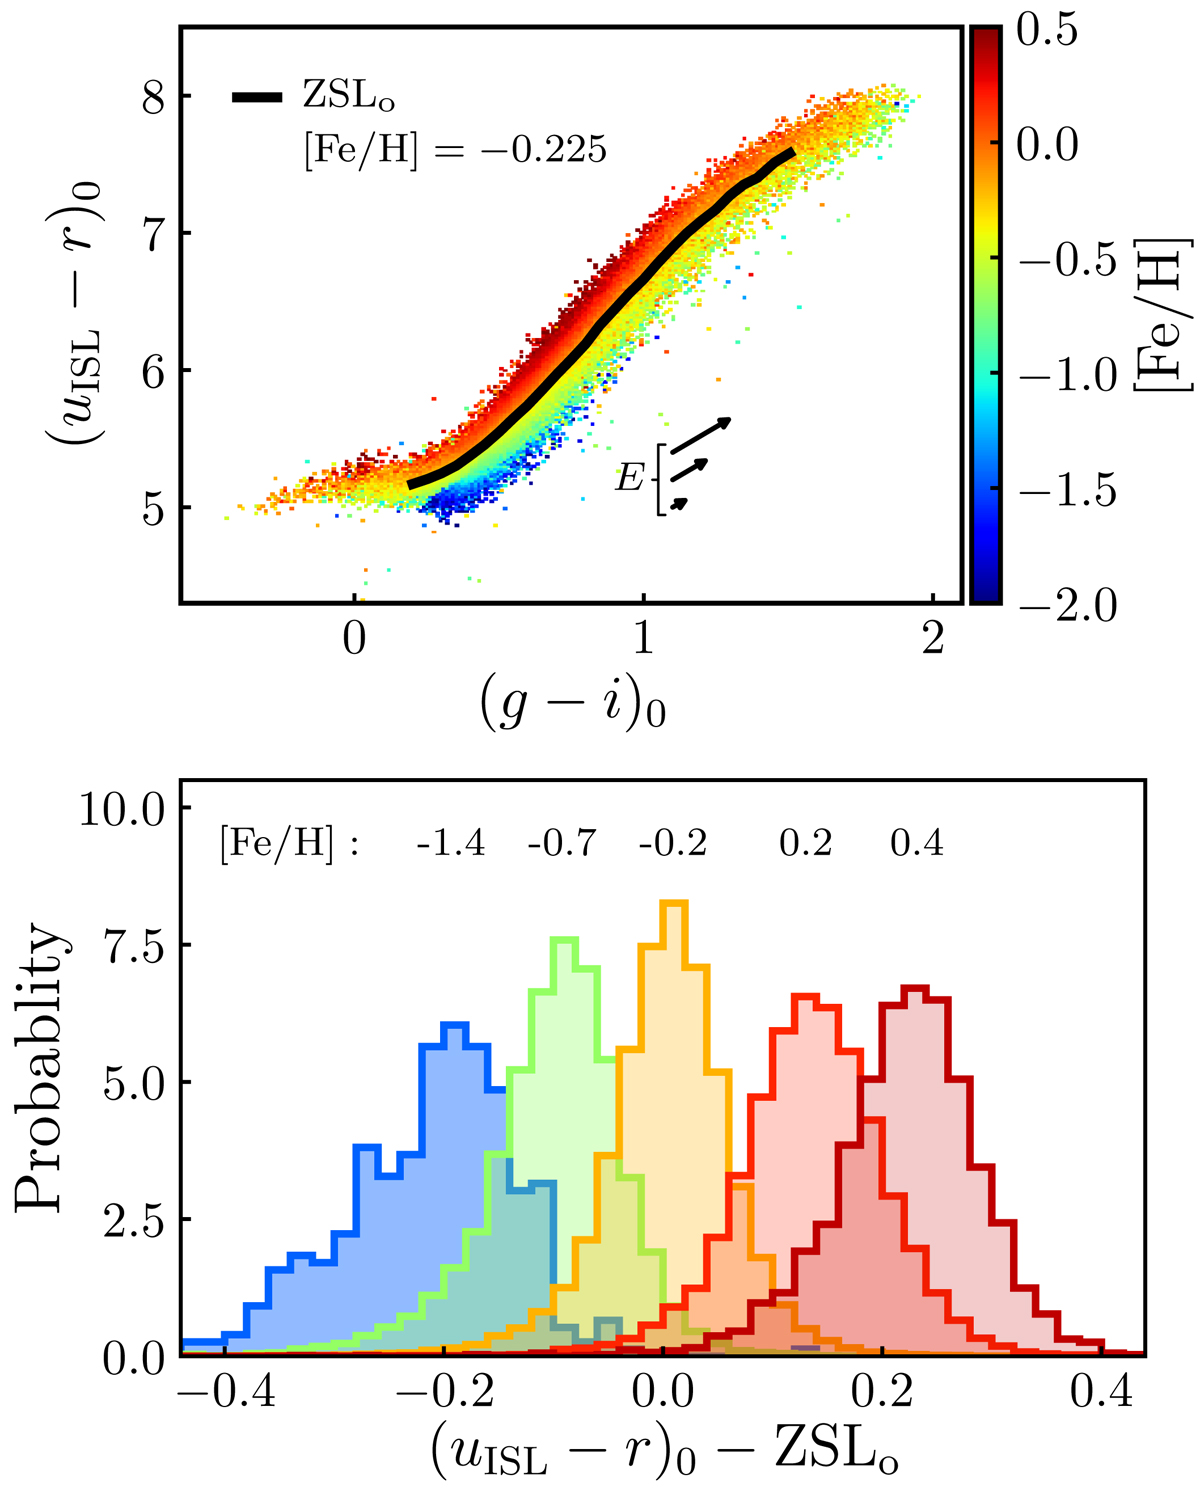
Download original image
Top panel: binned (uISL − r)0 versus (g − i)0 color-color diagram. The color scale shows the median [Fe/H] in each bin estimated from LAMOST spectra. The black solid line marks the stellar locus for −0.25 < [Fe/H] < −0.20 stars in the range 0.2 < (g − i)0 < 1.5, noted ZSLo. The arrows show the color excess vector (E) for the 50th, 90th, and 99th percentiles of the sources’ E(B − V) distributions, corresponding to E(B − V) = 0.03, 0.08, and 0.12, respectively. Bottom panel: normalized histogram of the (uISL − r)0 color difference with respect to ZSLo for samples of different metallicities, defined with a central [Fe/H] ±0.1 dex. The central metallicity of each sample is labeled in the panel.
Current usage metrics show cumulative count of Article Views (full-text article views including HTML views, PDF and ePub downloads, according to the available data) and Abstracts Views on Vision4Press platform.
Data correspond to usage on the plateform after 2015. The current usage metrics is available 48-96 hours after online publication and is updated daily on week days.
Initial download of the metrics may take a while.