Fig. 11.
Download original image
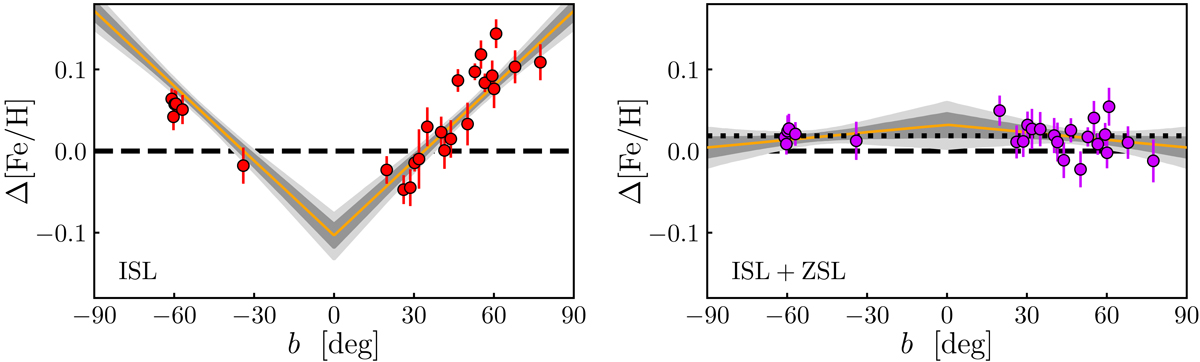
Metallicity difference between J-PLUS photometric values and APOGEE spectroscopic values, Δ[Fe/H], as a function of Galactic latitude b. Left panel: using 𝒳ISL photometry. Right panel: using 𝒳ISL + ZSL photometry. The solid lines in both panels show the best linear fitting to the data, with the gray areas depicting the 68% and 95% confidence intervals. The dashed lines mark zero difference. The dotted line in the right panel shows a difference of 0.02 dex.
Current usage metrics show cumulative count of Article Views (full-text article views including HTML views, PDF and ePub downloads, according to the available data) and Abstracts Views on Vision4Press platform.
Data correspond to usage on the plateform after 2015. The current usage metrics is available 48-96 hours after online publication and is updated daily on week days.
Initial download of the metrics may take a while.