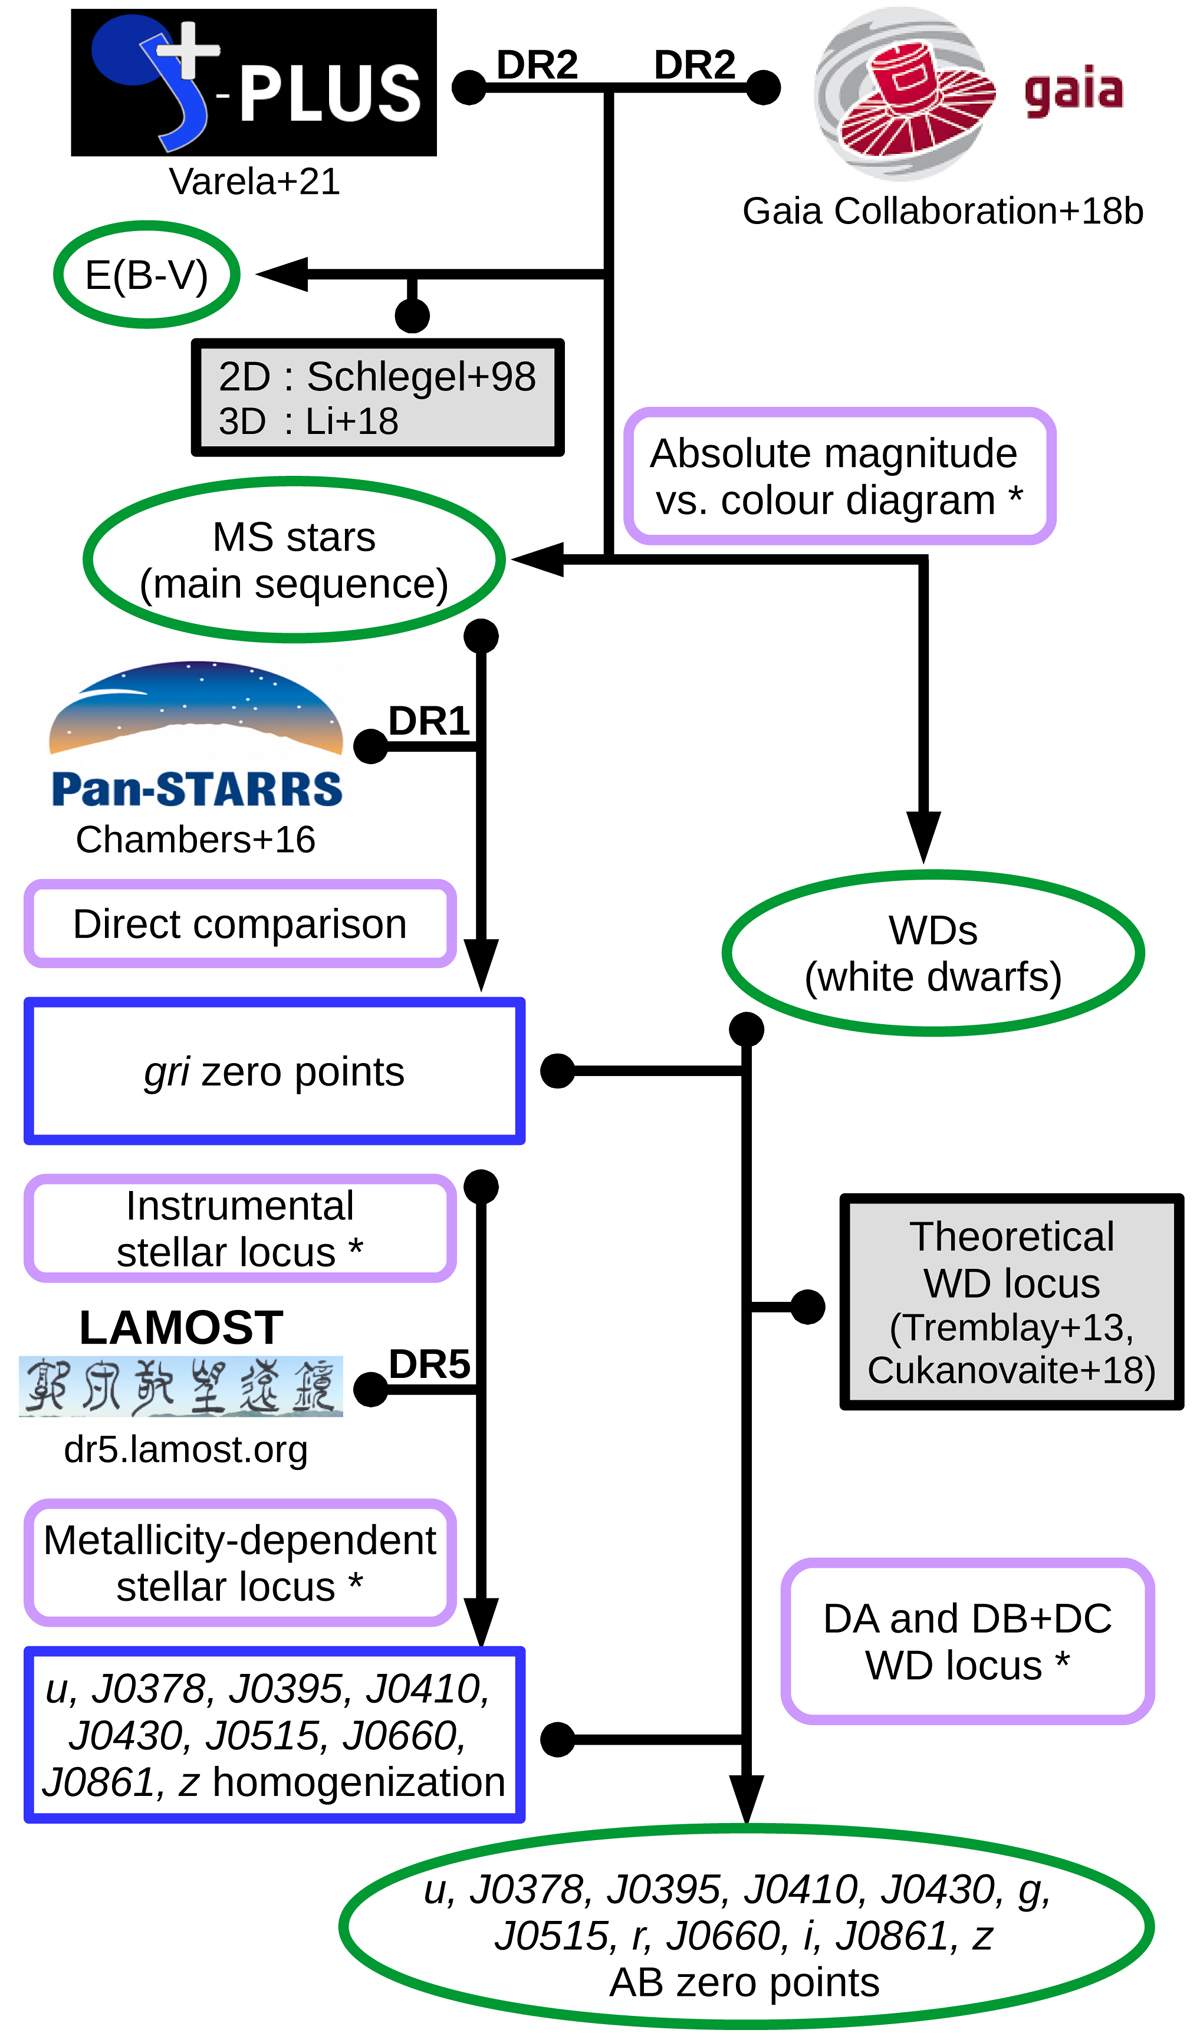
Fig. 1.
Download original image
Updated flowchart of the calibration method used in J-PLUS DR2. Arrows that originate in small dots indicate that the preceding data product is an input to the subsequent analysis. Datasets are shown with their project logo, and external codes or models are denoted with gray boxes. The rounded boxes show the calibration steps. The asterisks indicate those steps based on dust de-reddened magnitudes. The white boxes show intermediate data products, and ovals highlight data products of the calibration process. The changes with respect to J-PLUS DR1 calibration are the modification in the assumed dust extinction and the addition of the metallicity-dependent stellar locus step in the homogenization (Sect. 3.5).
Current usage metrics show cumulative count of Article Views (full-text article views including HTML views, PDF and ePub downloads, according to the available data) and Abstracts Views on Vision4Press platform.
Data correspond to usage on the plateform after 2015. The current usage metrics is available 48-96 hours after online publication and is updated daily on week days.
Initial download of the metrics may take a while.