Fig. 9
Download original image
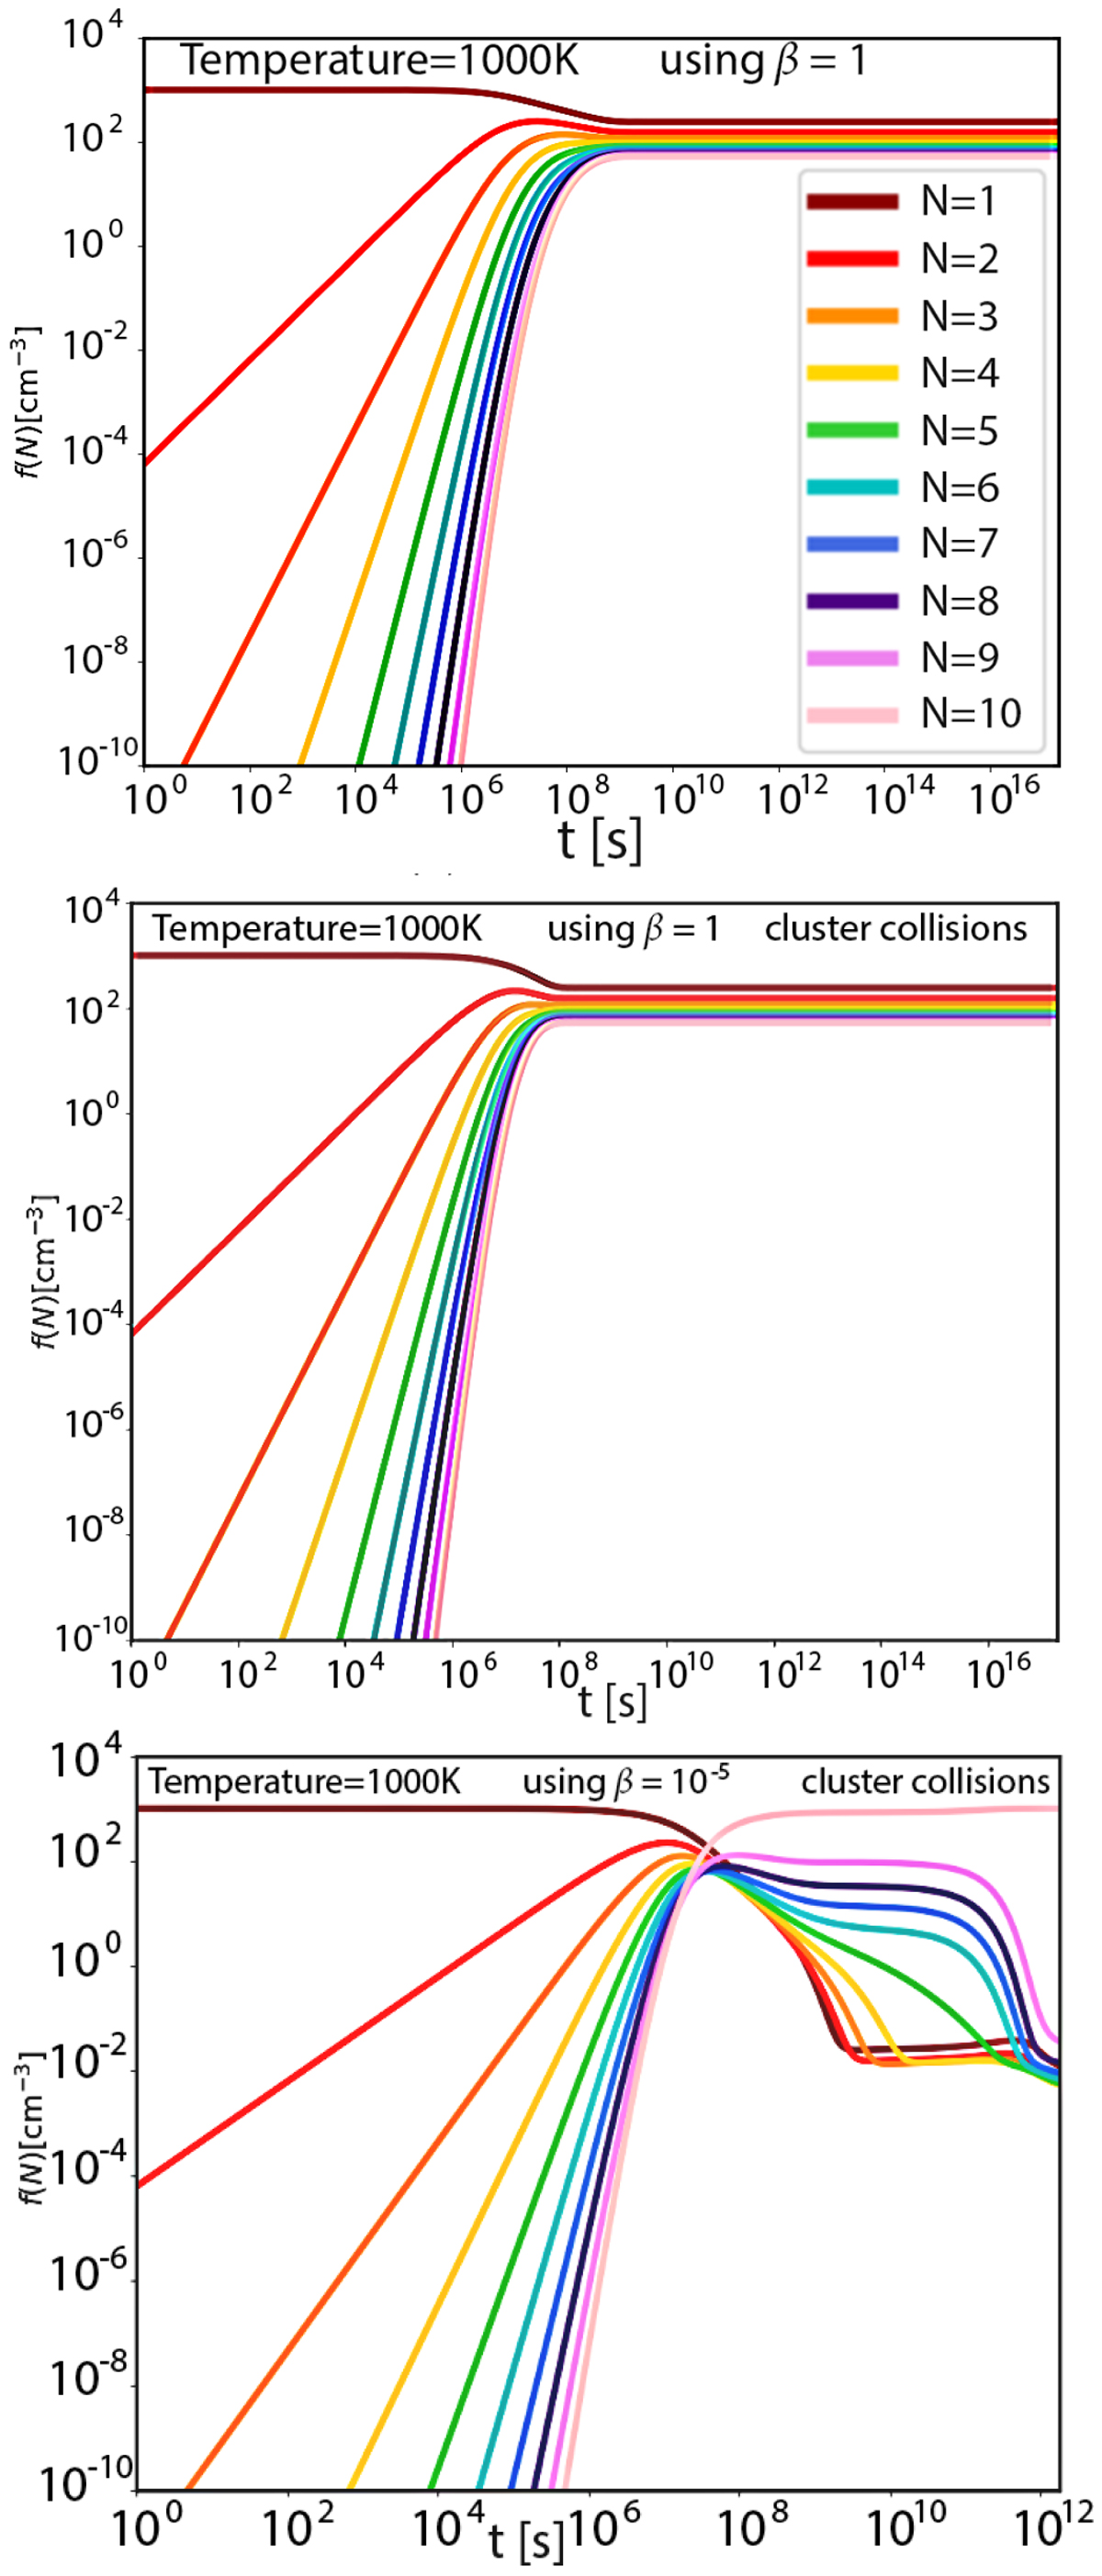
Cluster size distributions f(N) [cm−3 ] as a result of kinetic approach based on thermodynamic cluster data for clusters sizes N = 1 … 10 for α = 1 for T = 1000 K, β = 1.0 for the top two panels, and β = 10−5 for the bottom panel in order to visualise the relative importance of cluster evaporation. The differences between the cluster-monomer (top) and the cluster–cluster (bottom) results appear small for the small clusters, and are amplified if the evaporation efficiency is suppressed.
Current usage metrics show cumulative count of Article Views (full-text article views including HTML views, PDF and ePub downloads, according to the available data) and Abstracts Views on Vision4Press platform.
Data correspond to usage on the plateform after 2015. The current usage metrics is available 48-96 hours after online publication and is updated daily on week days.
Initial download of the metrics may take a while.