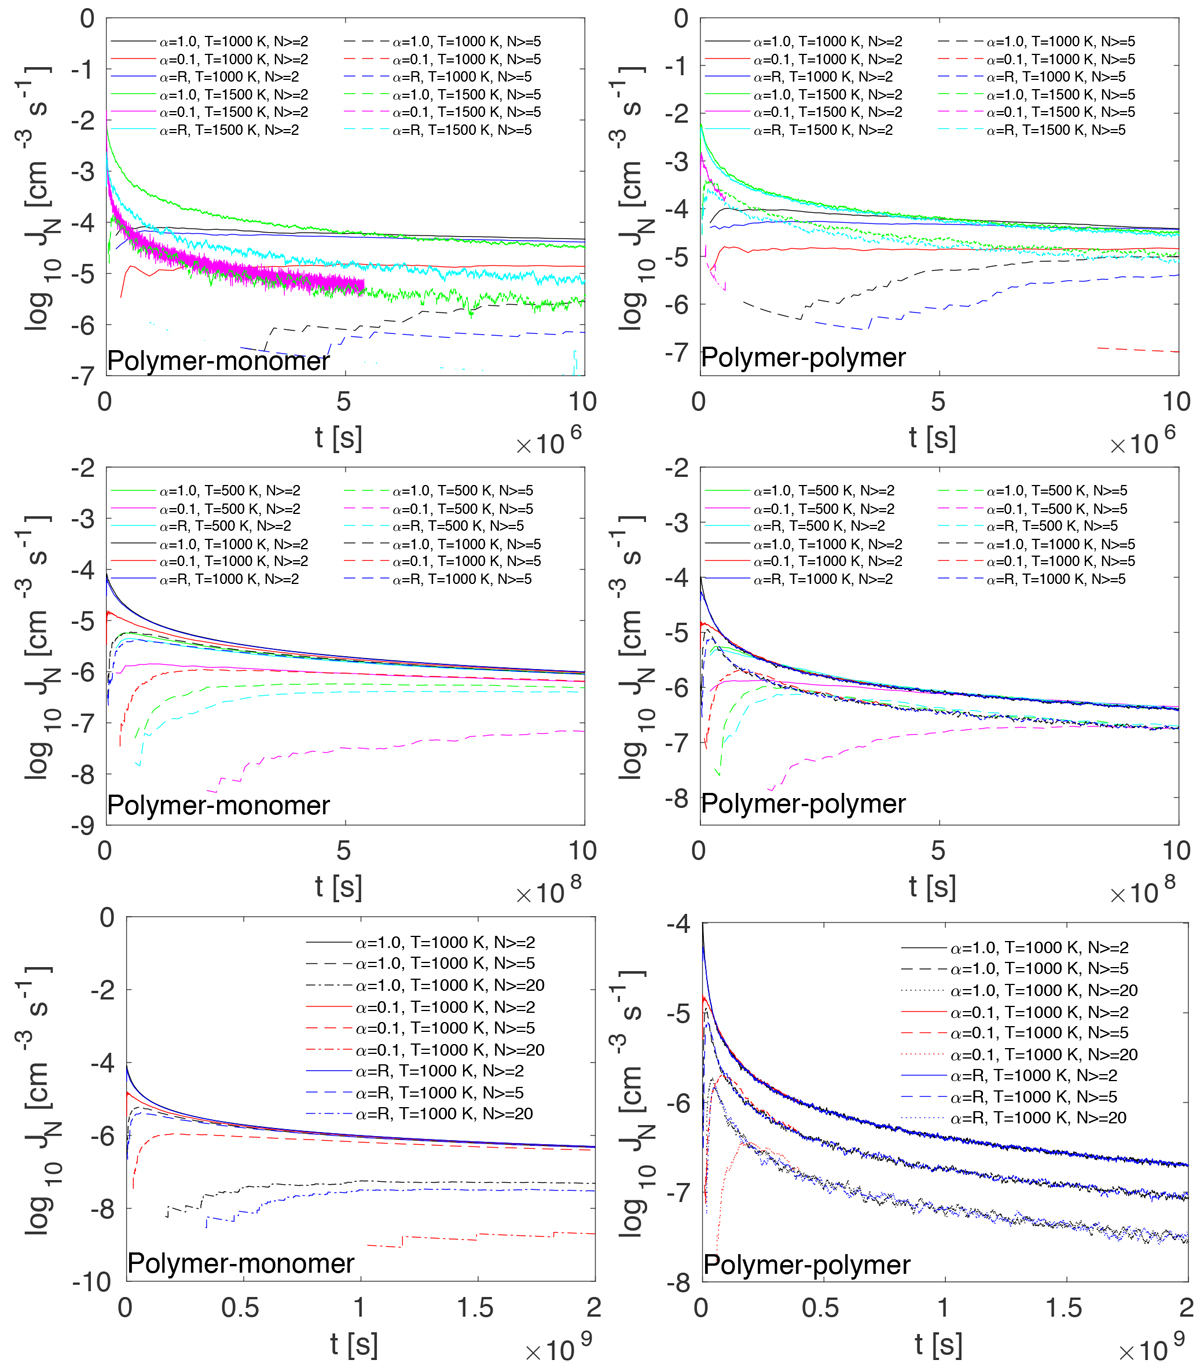
Fig. 6
Download original image
Time evolution of the cluster formation rate, JN (cm−3 s−1), for different temperatures and sticking probabilities. Left column: for clusters larger than N = 2, 5, 20 from polymer–monomer cluster growth. Right column: for clusters larger than N = 2, 5, 20 from polymer–polymer cluster growth. Top: early time evolution until t = 107 s for T = 500 K, 1000 K; only J>2 and J>5 appear. Middle: intermediate time evolution until t = 109 s for T = 500 K, 1000 K, for J>2 and J>5. Bottom: long-term evolution until t = 2 × 10⁹ s for J>2, J>5, and also J>20 for T = 1000 K only. No clusters >20 have yet formed for T = 500 K.
Current usage metrics show cumulative count of Article Views (full-text article views including HTML views, PDF and ePub downloads, according to the available data) and Abstracts Views on Vision4Press platform.
Data correspond to usage on the plateform after 2015. The current usage metrics is available 48-96 hours after online publication and is updated daily on week days.
Initial download of the metrics may take a while.