Fig. 5
Download original image
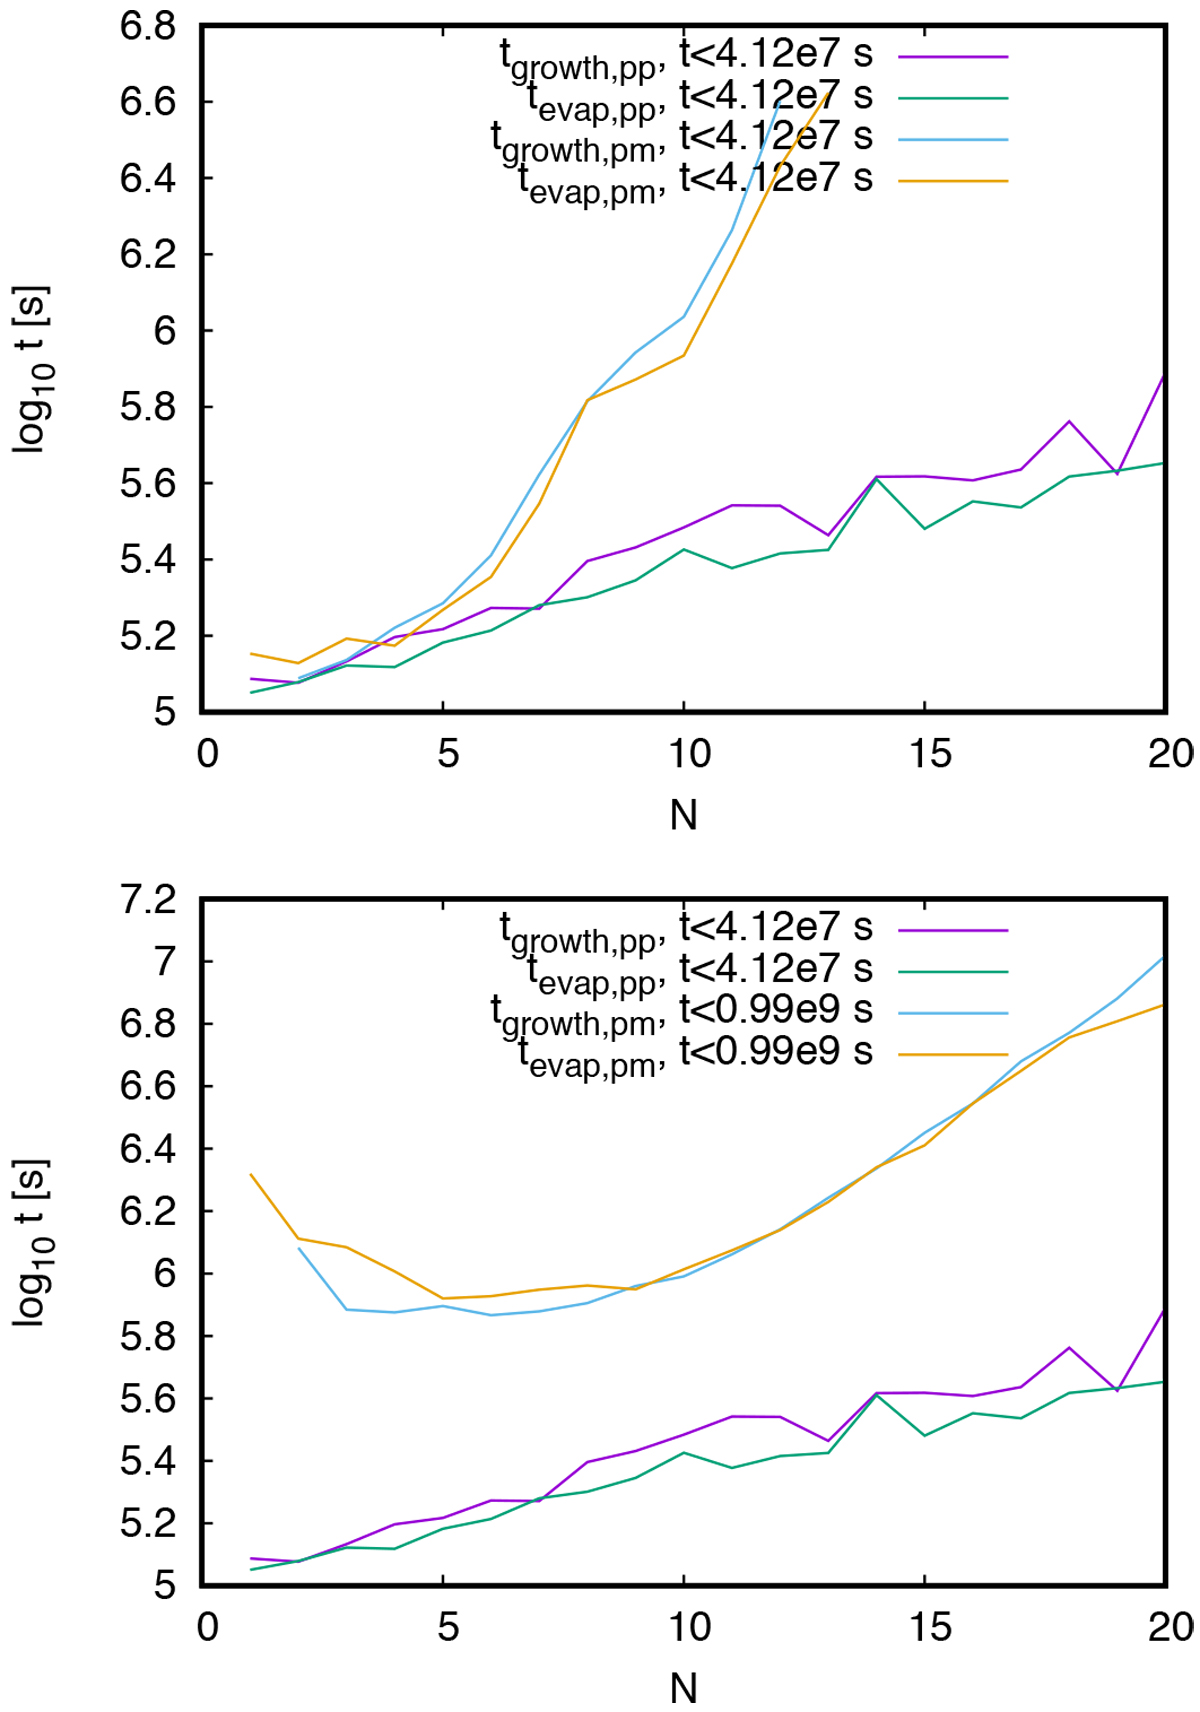
Average (net) TiO2 cluster growth and evaporation times for α = 1, T = 1000 K, and ftot, gas = 103 cm−3. pp: polymer–polymer; pm: polymer–monomer. Top: the values are evaluated until tmax = 4.12 × 10⁷ s, which corresponds to the JN≥20 peak time for polymer–polymer cluster growth (see Fig. 6, bottom right). Bottom: the values are evaluated until different total run times t to capture the polymer–monomer peaks at t = 0.99 × 10⁹ s (see Fig. 6, bottom left).
Current usage metrics show cumulative count of Article Views (full-text article views including HTML views, PDF and ePub downloads, according to the available data) and Abstracts Views on Vision4Press platform.
Data correspond to usage on the plateform after 2015. The current usage metrics is available 48-96 hours after online publication and is updated daily on week days.
Initial download of the metrics may take a while.