Fig. 7
Download original image
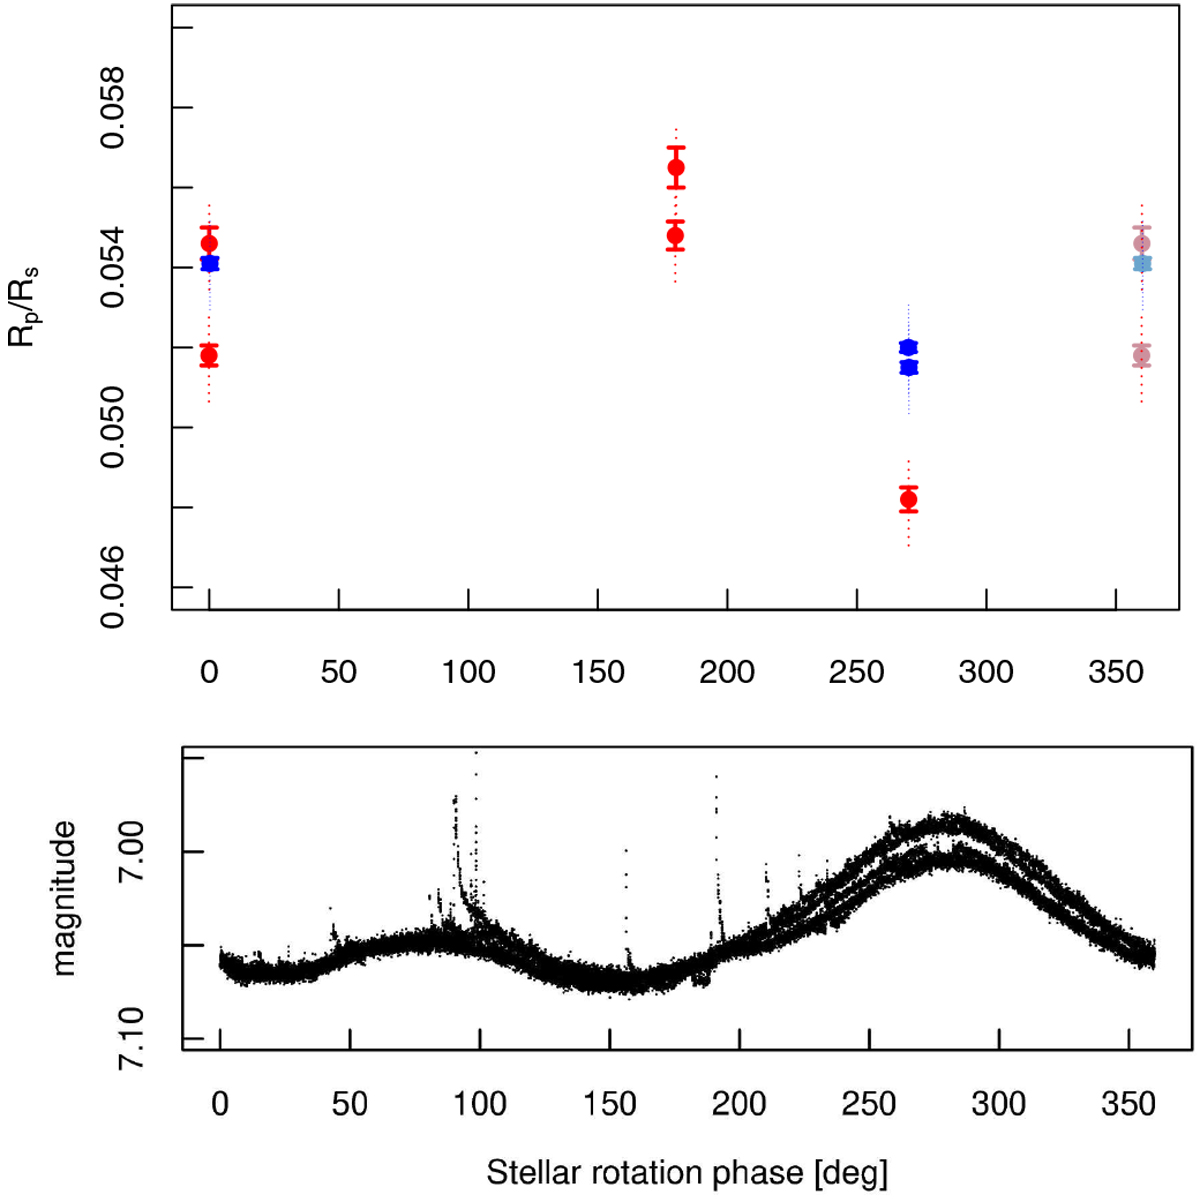
Planet-to-star radius ratio versus stellar rotation phase. The red and blue circles mark the TESS and CHEOPS transits, respectively, as modelled with pyaneti. (We note that the data points at phase 0° are repeated at phase 360° for clarity.) The solid error bars are the nominal uncertainty (precision), while the dotted lines are the uncertainties after accounting for the lack of accuracy with the bootstrap method described in Sect. 4.3.
Current usage metrics show cumulative count of Article Views (full-text article views including HTML views, PDF and ePub downloads, according to the available data) and Abstracts Views on Vision4Press platform.
Data correspond to usage on the plateform after 2015. The current usage metrics is available 48-96 hours after online publication and is updated daily on week days.
Initial download of the metrics may take a while.