Fig. 4
Download original image
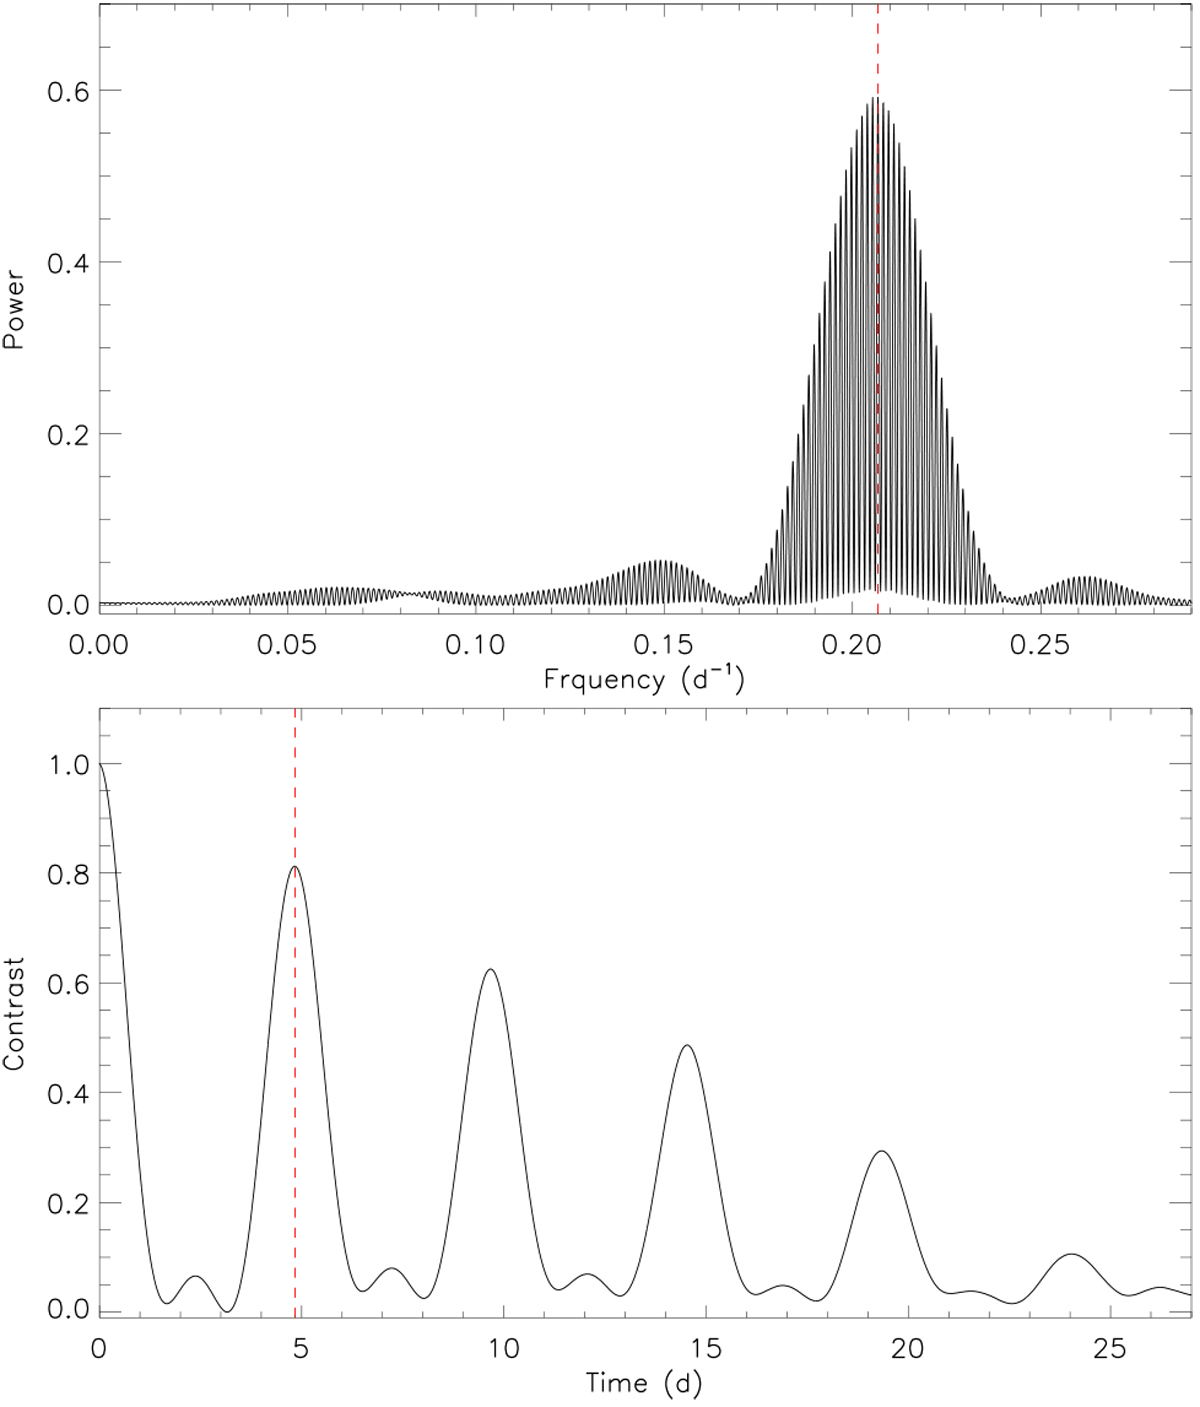
Upper panel: generalised Lomb-Scargle periodogram of the combined S1 and S27 TESS light curves. The red dashed line marks the rotation period of the star. The equally spaced peaks symmetrically distributed around the dominant frequency are due to the ~2-yr gap between the two TESS observations. Lower panel: autocorrelation function of the combined TESS light curve. The red dashed line marks the rotation period of the star.
Current usage metrics show cumulative count of Article Views (full-text article views including HTML views, PDF and ePub downloads, according to the available data) and Abstracts Views on Vision4Press platform.
Data correspond to usage on the plateform after 2015. The current usage metrics is available 48-96 hours after online publication and is updated daily on week days.
Initial download of the metrics may take a while.