Fig. 7.
Download original image
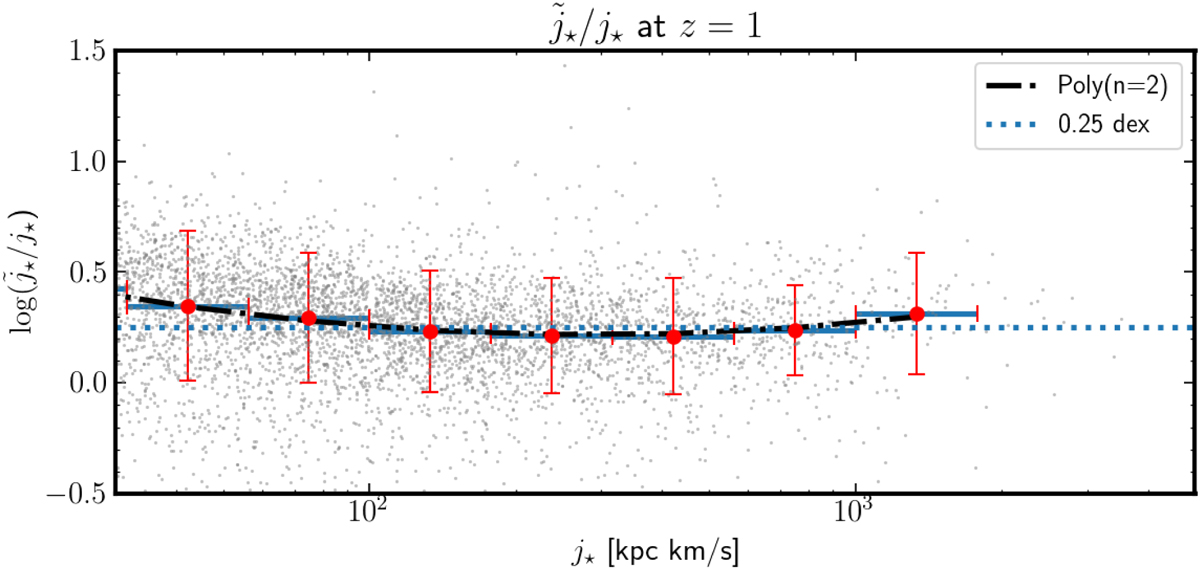
Relation between the stellar sAM j⋆ and ![]() for z = 1 TNG50 SFGs. The solid points with errorbars represent the median difference between the two as a function of the stellar angular momentum, where the error bars represent the standard deviation. Thus, the SFR-weighted sAM,
for z = 1 TNG50 SFGs. The solid points with errorbars represent the median difference between the two as a function of the stellar angular momentum, where the error bars represent the standard deviation. Thus, the SFR-weighted sAM, ![]() , is higher by ≈ 0.25 dex (dotted line) compared to j⋆ over a wide range of sAM from 50 to 2000 km s−1 kpc. A second order polynomial fit is shown with the dot-dashed black line.
, is higher by ≈ 0.25 dex (dotted line) compared to j⋆ over a wide range of sAM from 50 to 2000 km s−1 kpc. A second order polynomial fit is shown with the dot-dashed black line.
Current usage metrics show cumulative count of Article Views (full-text article views including HTML views, PDF and ePub downloads, according to the available data) and Abstracts Views on Vision4Press platform.
Data correspond to usage on the plateform after 2015. The current usage metrics is available 48-96 hours after online publication and is updated daily on week days.
Initial download of the metrics may take a while.