Fig. 3
Download original image
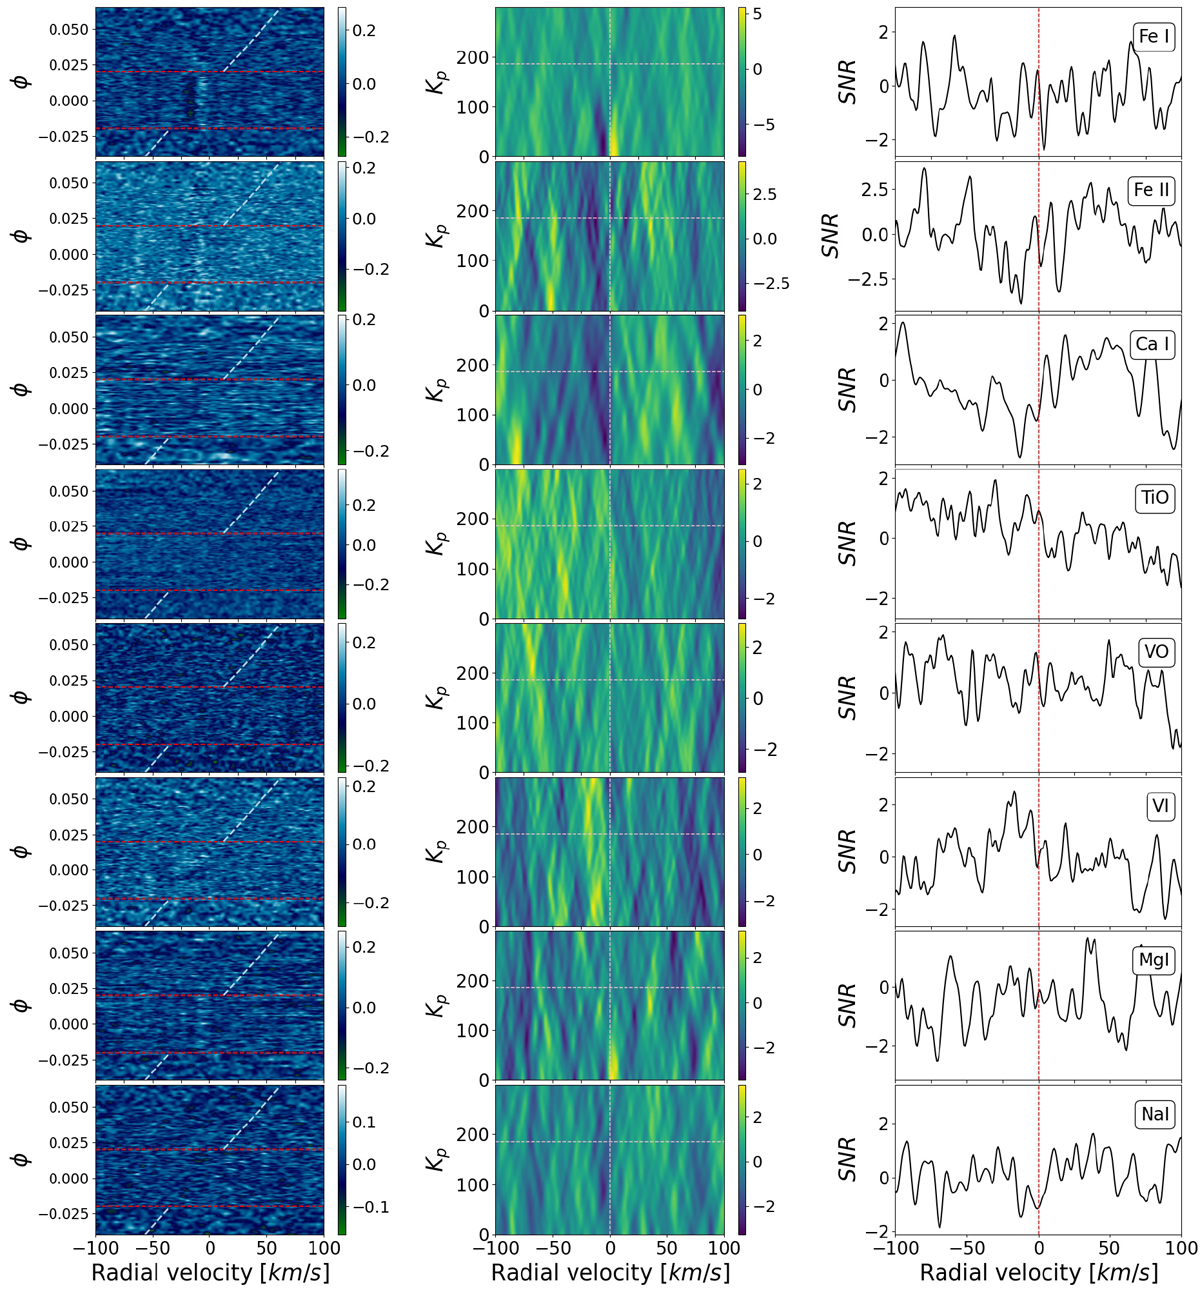
Left panels: cross-correlation residual maps of Fe I, Fe II, Ca II, TiO, VO, V I, Mg I, and Na I for combination of two night from HARPS-N. Red horizontal map shows beginning and end of the transit. Light-blue tilted line presents trace of expected signal from the planet. Middle panels: significance map for Kp in a range of 0–300 km s−1, we expect signal from the planet in the 0 km s−1 radial velocities and Kp = 185.3 km s−1 marked with dashed lines. Right panels: S/N plot for expected Kp value. Here, the RM+CLV effects have not been corrected.
Current usage metrics show cumulative count of Article Views (full-text article views including HTML views, PDF and ePub downloads, according to the available data) and Abstracts Views on Vision4Press platform.
Data correspond to usage on the plateform after 2015. The current usage metrics is available 48-96 hours after online publication and is updated daily on week days.
Initial download of the metrics may take a while.