Fig. A.3
Download original image
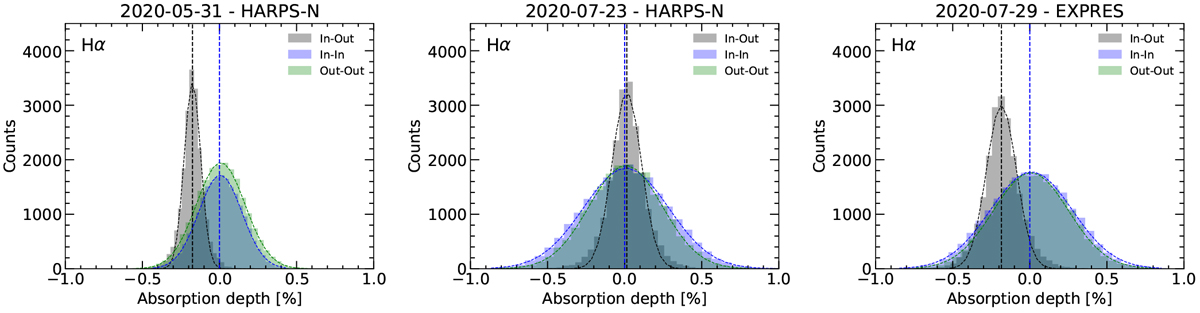
Empirical Monte Carlo (EMC) distributions in the Hα line for the first (left) and second (middle) nights observed with HARPS-N, and the night observed with EXPRES (right). The distributions are obtained using 20 000 iterations and measuring the absorption depth with a bandwidth of 0.75 Å. Each panel corresponds to the analysis of one night. In green we present the ‘out-out’ scenario, in blue the ‘in-in’, and in grey the ‘in-out’, which corresponds to the atmospheric absorption scenario. The blue-dashed vertical line marks the zero absorption level and the black-dashed line the center of the ‘in-out’ distribution.
Current usage metrics show cumulative count of Article Views (full-text article views including HTML views, PDF and ePub downloads, according to the available data) and Abstracts Views on Vision4Press platform.
Data correspond to usage on the plateform after 2015. The current usage metrics is available 48-96 hours after online publication and is updated daily on week days.
Initial download of the metrics may take a while.