Fig. A.2
Download original image
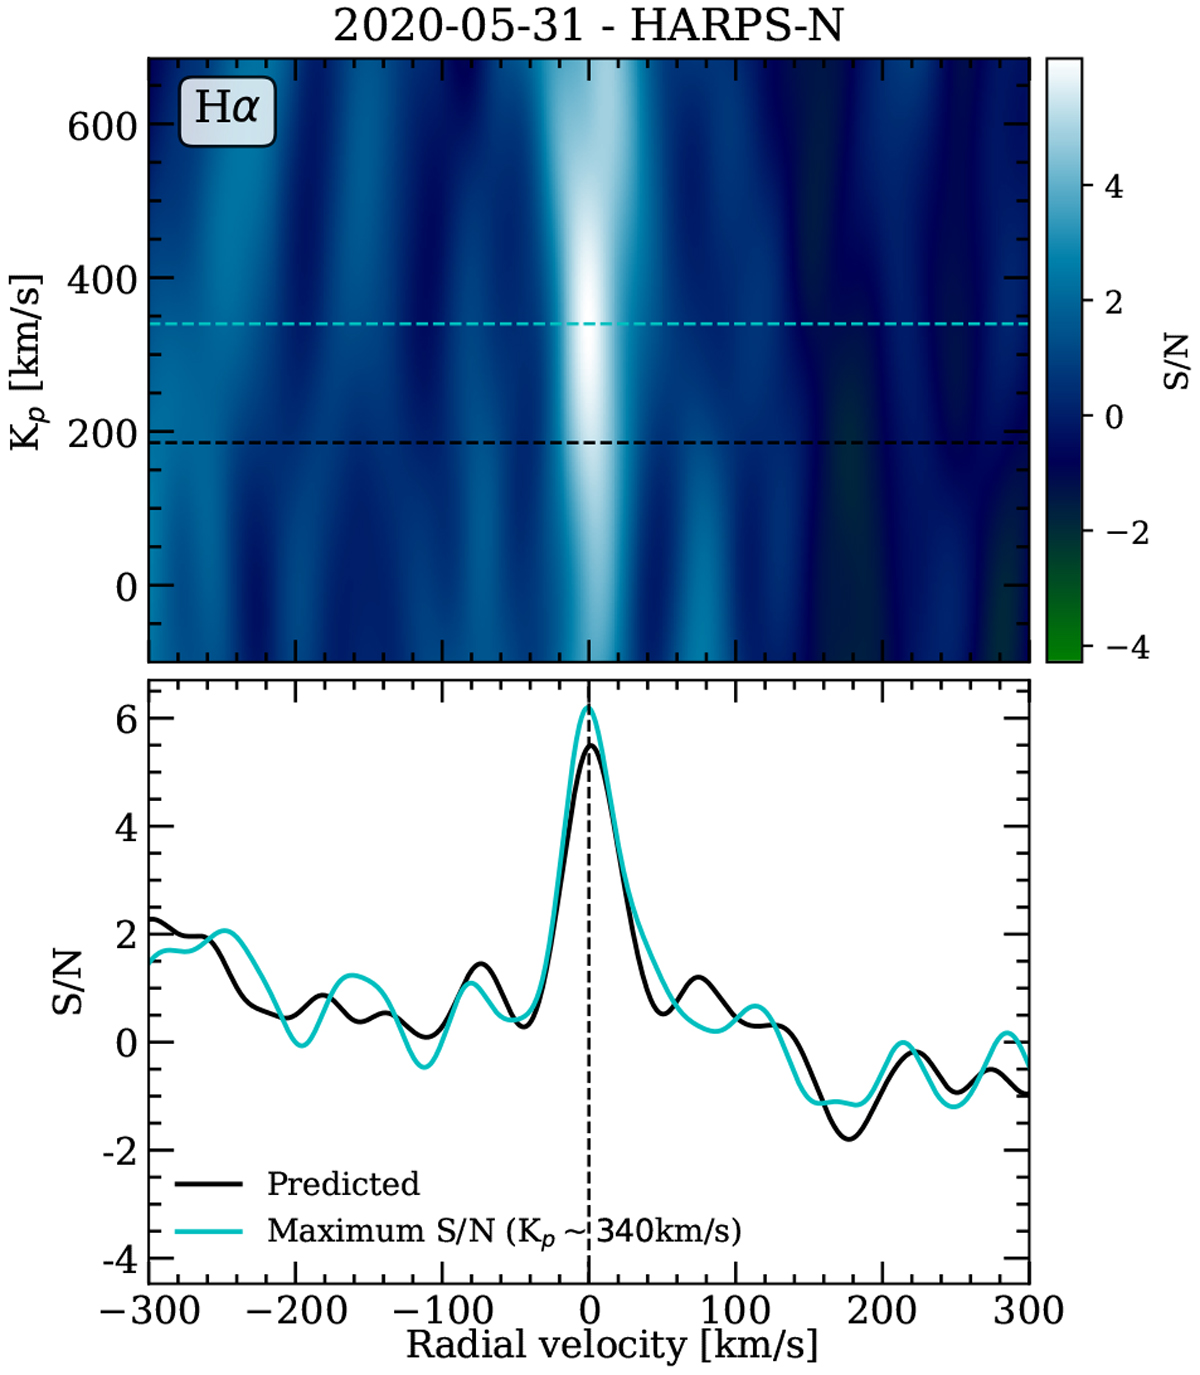
Cross-correlation results around the Hα line of the first night. Top panel: Kp map of the cross-correlation values. The cyan-dashed line indicates the Kp position with maximum S/N. The horizontal black dashed line shows the predicted Kp = 188.15 km s−1 value, the cyan-dashed line the Kp ~ 340 km s−1 at which the S/N is maximum, and the vertical black dashed line shows 0 km s−1 shift. Bottom panel: cross-correlation values extracted at the maximum S/N Kp (cyan), and at the predicted Kp (black).
Current usage metrics show cumulative count of Article Views (full-text article views including HTML views, PDF and ePub downloads, according to the available data) and Abstracts Views on Vision4Press platform.
Data correspond to usage on the plateform after 2015. The current usage metrics is available 48-96 hours after online publication and is updated daily on week days.
Initial download of the metrics may take a while.