Fig. 1
Download original image
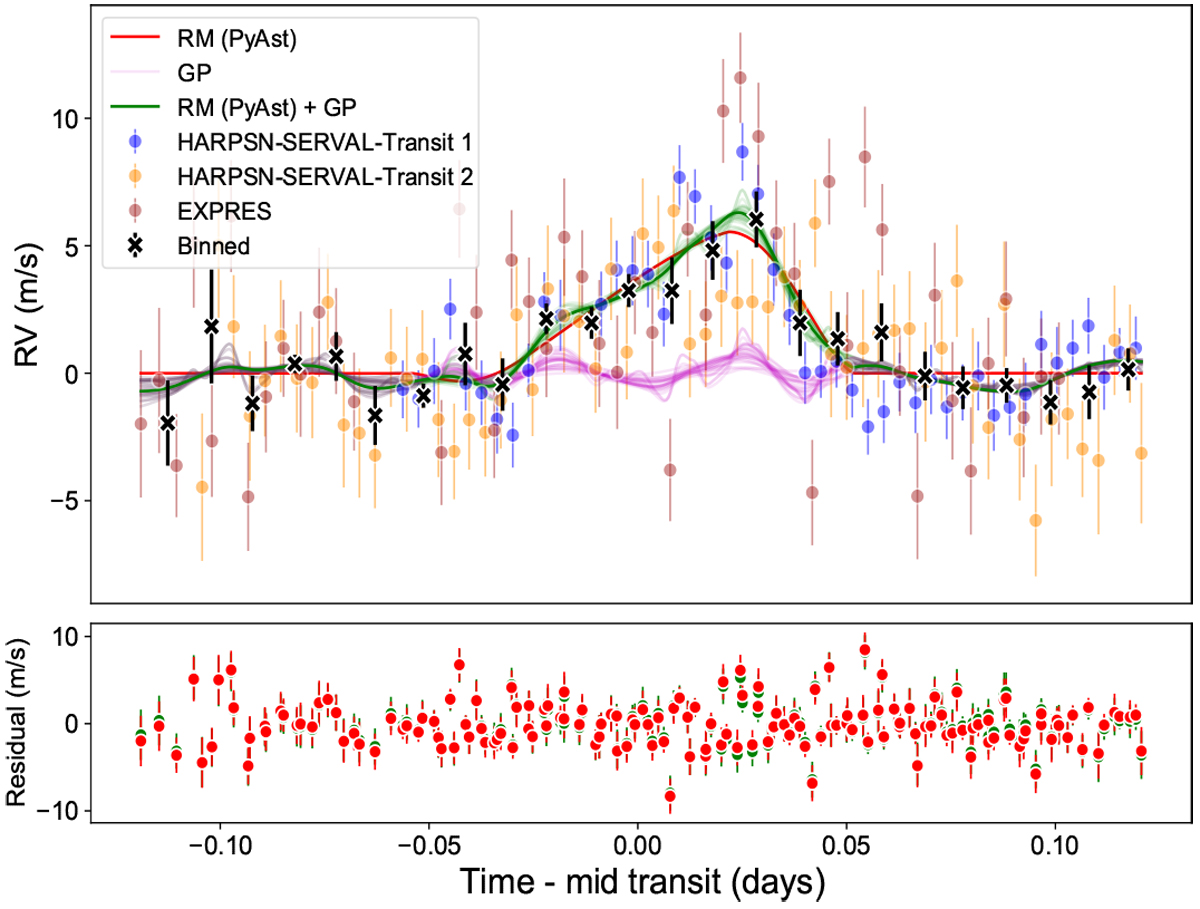
Radial velocity time series derived using the template matching approach for each of the three transits. Also shown is the binned data from combining all three transits. The best fit model to the folded RM is shown using a PyAstronomy model incorporating a GP. The different components of the best fit model are plotted in different colors as marked in the legend. The residual between the best fit model using PyAstronomy and GP+PyAstronomy and observations are shown in red and green circles, respectively, in the bottom panel.
Current usage metrics show cumulative count of Article Views (full-text article views including HTML views, PDF and ePub downloads, according to the available data) and Abstracts Views on Vision4Press platform.
Data correspond to usage on the plateform after 2015. The current usage metrics is available 48-96 hours after online publication and is updated daily on week days.
Initial download of the metrics may take a while.