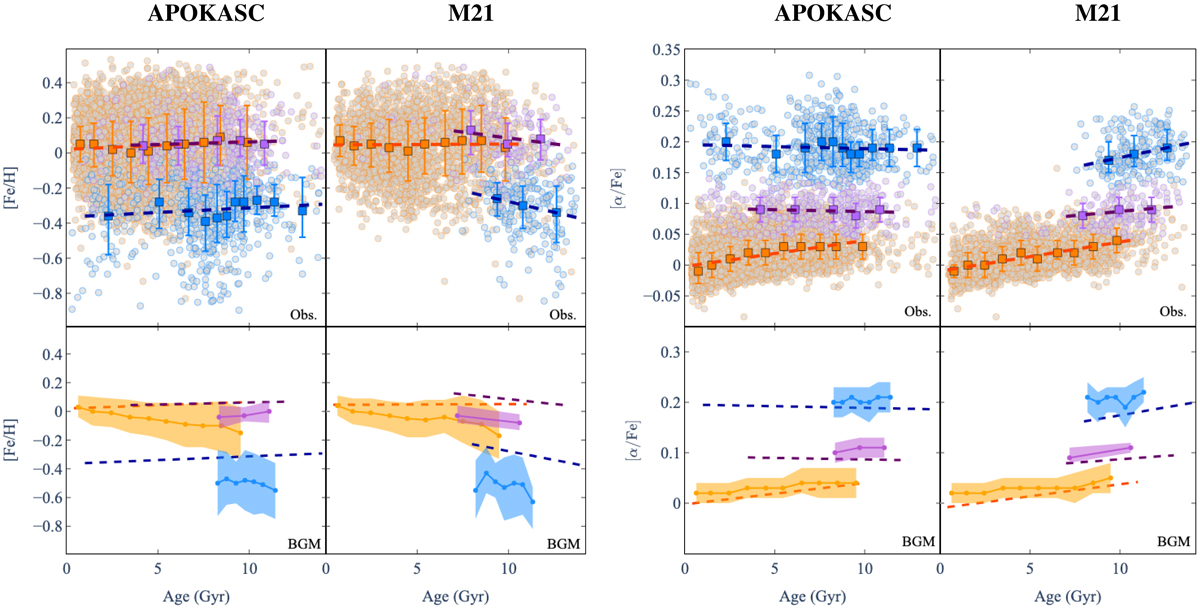
Fig. 8.
Download original image
[Fe/H] (left) and [α/Fe] (right) as a function of stellar age in our sample taking into account stellar ages from APOKASC and M21. All stars from both samples are shown (coloured dots). The mean value per age bin is shown (square) for the thin-disc (orange), hαmr, and hαmp thick-disc (magenta and blue respectively) populations. The mean value was computed between the 5% and 95% quantile of the sample to avoid extreme values. The 1σ error bars are shown. The dashed lines are linear fits. Bottom panels: BGM predictions corresponding to observations and represented by solid lines. The ±1σ error bars are shown with shadow regions. Linear fits done for observations are recalled with dashed lines.
Current usage metrics show cumulative count of Article Views (full-text article views including HTML views, PDF and ePub downloads, according to the available data) and Abstracts Views on Vision4Press platform.
Data correspond to usage on the plateform after 2015. The current usage metrics is available 48-96 hours after online publication and is updated daily on week days.
Initial download of the metrics may take a while.