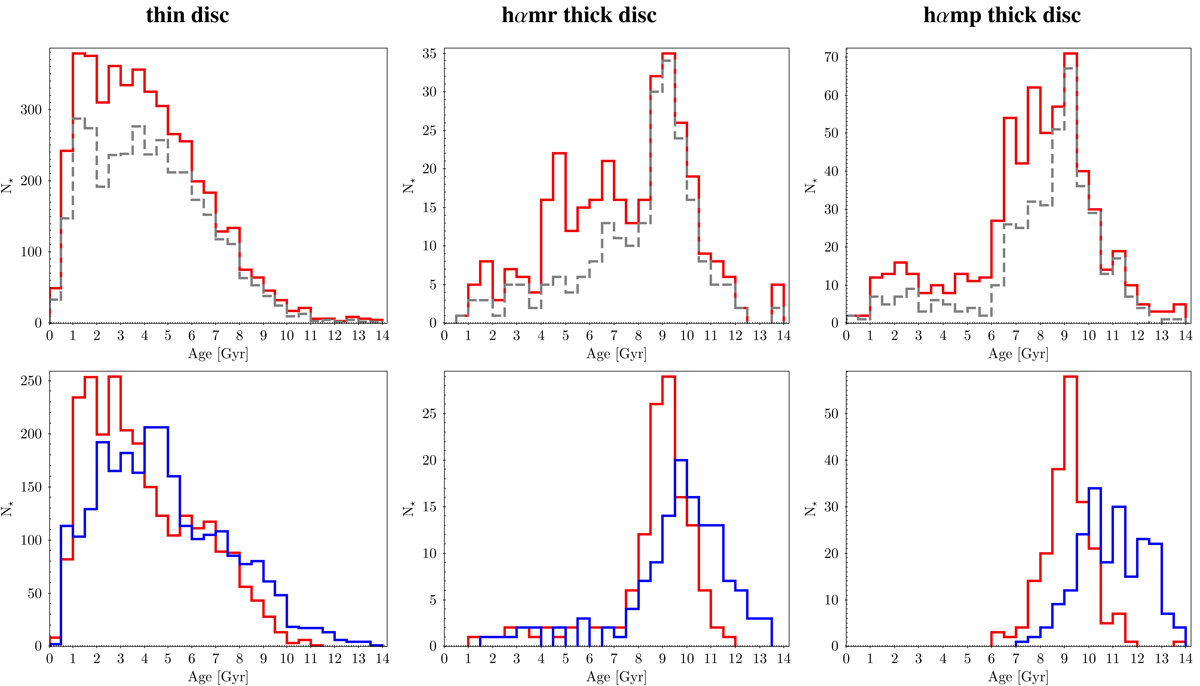
Fig. 7.
Download original image
Age distributions for the thin-, hαmr, and hαmp thick-disc populations, from left to right panels, respectively. Top panels: age distributions from the APOKASC catalogue (red histogram) and with a relative error of less than 25% (grey dotted line). Bottom panels: age distributions from M21 (blue solid line) and from APOKASC (with a relative error less than 25%) for the subsample of stars in common (red solid line).
Current usage metrics show cumulative count of Article Views (full-text article views including HTML views, PDF and ePub downloads, according to the available data) and Abstracts Views on Vision4Press platform.
Data correspond to usage on the plateform after 2015. The current usage metrics is available 48-96 hours after online publication and is updated daily on week days.
Initial download of the metrics may take a while.