Fig. 4.
Download original image
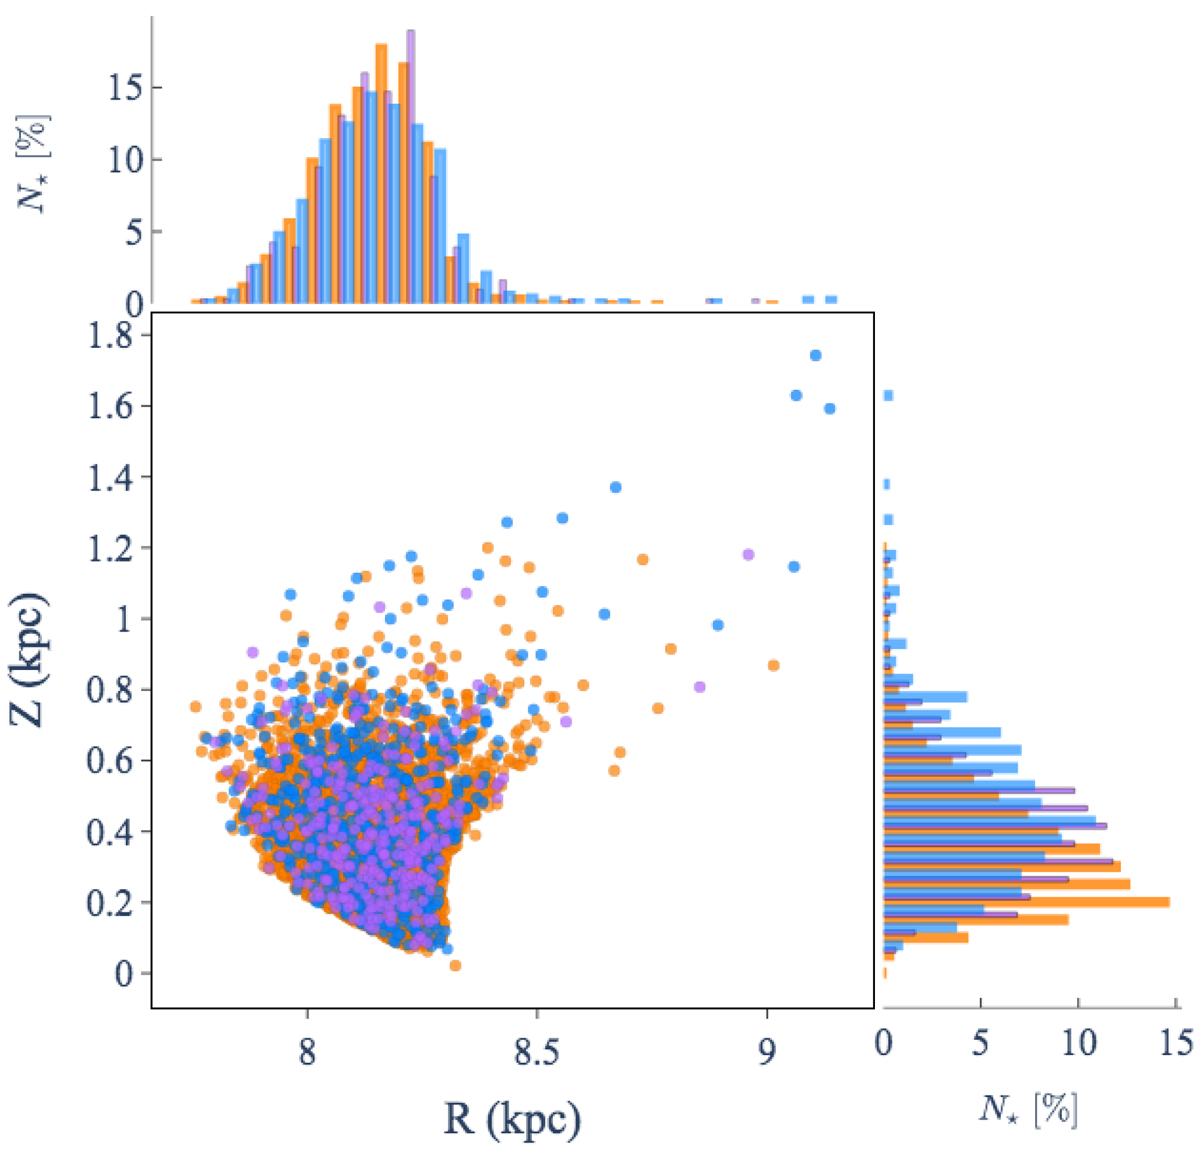
Vertical distance from the Galactic plane (Z) as a function of galactocentric distance (R). We also show the respective normalised distributions of R and Z. The thin-disc, high-α metal-rich, and high-α metal-poor thick-disc populations are shown in orange, purple, and blue, respectively. This separation into three stellar components is discussed in Sect. 4.
Current usage metrics show cumulative count of Article Views (full-text article views including HTML views, PDF and ePub downloads, according to the available data) and Abstracts Views on Vision4Press platform.
Data correspond to usage on the plateform after 2015. The current usage metrics is available 48-96 hours after online publication and is updated daily on week days.
Initial download of the metrics may take a while.