Fig. 15.
Download original image
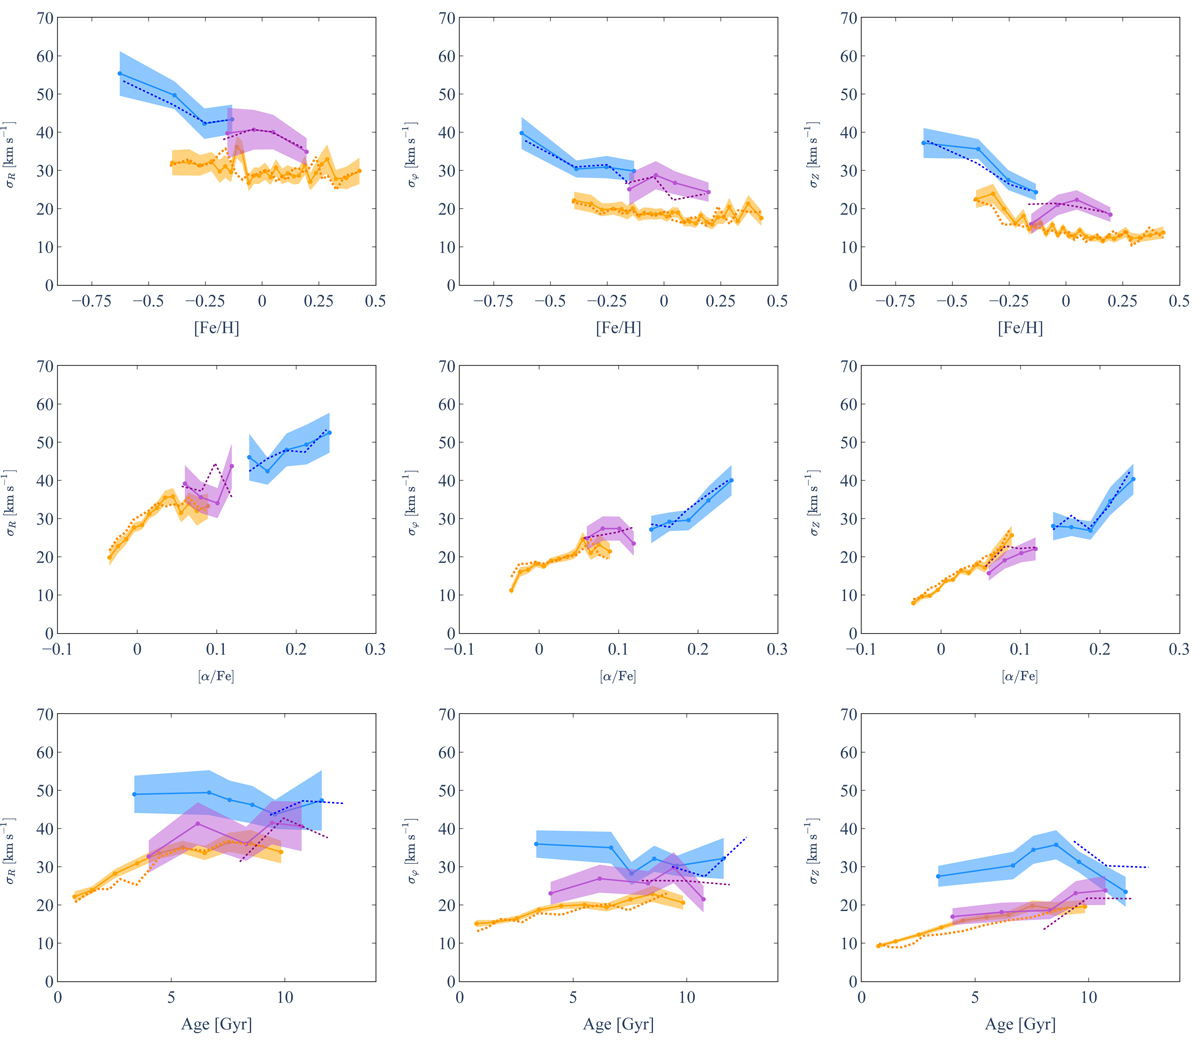
Dispersion of the velocities VR (left panels), Vφ (middle panels), VZ (right panels) as a function of [Fe/H] (top panels), [α/Fe] (middle panels), and age (bottom panels) for the thin-disc, hαmp, and hαmr thick-disc populations (orange, blue, and magenta symbols, respectively). Solid lines represent velocity dispersions computed using chemistry and stellar ages from the APOKASC catalogue, while dotted lines represent velocity dispersions computed using abundances derived from DR16 APOGEE data (top and middle panels) and using stellar ages derived by M21 (bottom panels). Error bars on the velocity dispersions are also shown.
Current usage metrics show cumulative count of Article Views (full-text article views including HTML views, PDF and ePub downloads, according to the available data) and Abstracts Views on Vision4Press platform.
Data correspond to usage on the plateform after 2015. The current usage metrics is available 48-96 hours after online publication and is updated daily on week days.
Initial download of the metrics may take a while.